Australia’s agricultural landscapes support a great range of soils. Most are ancient, strongly weathered and infertile by world standards.
Soils are complex and three-dimensional and form over time. They have different physical and chemical properties in different directions. For example three soils may have the same sandy surface, but one remains sandy with depth (deep sand), another gradually increases in clay (sandy earth), and the third has a layer of sand over a layer of clay (duplex). Similarly some soils may extend for many kilometres, but more often many different soils can occur in a single farm paddock. Even if a soil in a paddock looks the same, its chemical properties (such as fertility and pH) may vary markedly.
Classifying soil
To make sense of soil-type differences for agricultural production we classify soils so that we can correlate or contrast soils in different regions, often so that we can estimate if particular research or production methods are likely to work elsewhere. In Western Australia, soils are commonly classified into Western Australian Soil Groups but may also be classified according to the Australian Soil Classification system. Throughout the world, other soil classification systems are used, for example the World Reference Base of soils. The Australian Soil Classification (ASC) system is used primarily in scientific communications and the Western Australian soil groups are usually used by the agricultural industry and government departments.
In many regions farmers have developed local informal classification systems that help them recognise their soils. An example is ‘red soils’ common in the northern portion of the south-west agricultural region (near Geraldton) plus much of Australia’s arid interior. Unfortunately red soils may be sands or clays and everything in-between, and their chemical properties can also vary widely. For this reason we use formal classification systems, with detailed and specific diagnostic criteria.
Australian Soil Classification
The Australian Soil Classification is the official soil classification system for Australia. This is a hierarchical system:
- Order
- > Suborder
- > > great group
- > > > subgroup
- > > > > family.
Laboratory analysis is required to make some of the divisions. Using this system, hundreds of individual soils can be described. A key to the Australian Soil Classification can be found in Isbell the National Committee on Soil and Terrain (2021) The Australian soil classification, 3rd edition, CSIRO, Melbourne.
An Australian Soil Classification description is written with a different list order to the hierarchical classification, for example, Bleached (subgroup), Eutrophic (great group), Yellow (suborder) Chromosol (order); thin, gravelly, sandy/clayey, shallow (family). It is acceptable to present a shortened description if desired or if criteria for some levels of the hierarchy cannot be determined.
The main soil orders that are used for agricultural production in the south-west agricultural region are Chromosols, Tenosols, Kurosols, Sodosols and Kandosols. Chromosols and Kurosols are characterised by an abrupt increase in clay down the profile and are prone to an impeded internal drainage, hardsetting surface and general structural degradation. Sodosols are characterised by soils with an abrupt increase in clay down the profile and high exchangeable sodium percentage content and are prone to a perched water table, hardsetting surface, and erosion. Tenosols show a weak soil development, resulting in deep structureless sands, leading to low nutrient and waterholding capacity. Kandosols are structureless soils with general surface degradation. Consequently, the inherent capacity of these soils to retain plant nutrients and support cereal crop growth is naturally low.

Further reading
Book The Australian Soil Classification (3rd edn)
R F Isbell and the National Committee on Soil and Terrain (2021)
Soil Groups of Western Australia
In Western Australia we have adopted Western Australian Soil Groups largely because the names are simpler and more intuitive than Australian Soil Classification names. A soil classified according to one system does not necessarily fit into a single category in the other system.
The Soil Groups of Western Australia system is designed so that soils may be easily identified in the field, without expert knowledge of soil classification.
Thirteen soil supergroups are defined according to:
- the texture or permeability profile
- the presence and nature of coarse fragments
- the water regime.
The supergroups are divided into 60 soil groups according to
- the presence/absence of a calcareous layer
- colour
- depth of horizons and profile
- pH
- structure.
Soil groups may be further divided using a soil group qualifier. Qualifiers are a pragmatic division that conveys more information necessary to distinguish local soil properties relevant to soil management and crop yield, such as the presence of rock or saline layers.
The extra information provided by Soil Group qualifiers falls into five main categories:
- texture
- structure
- subsurface
- subsoil
- substrate related.
A key to the soil groups, distribution and descriptions, including the relationship between Western Australian Soil Groups and Australian Soil Classification, can be found in Schoknecht and Pathan (2013) Soil groups of Western Australia: a simple guide to the main soils of Western Australia (4th ed), Report 380, Department of Agriculture and Food, Western Australia.
Soil Groups of Western Australia
| Soil Supergroup | Description | Soil groups |
|---|---|---|
| Wet or waterlogged soil | Wet within 80 cm of the soil surface for majority of year | Saline wet soil; Salt lake soil; Semi-wet soil; Tidal soil; Wet soil |
| Rocky or stony soil | Generally shallow soils; >50% coarse fragments > 20 mm in size | Bare rock; Calcareous stony soil; Stony soil |
| Ironstone gravel soils | Ironstone gravel layer or cemented gravel layer within 15 cm of surface | Shallow gravel; Duplex sandy gravel; Deep sandy gravel; Loamy gravel |
| Sandy duplexes | Sandy surface with texture or permeability contrast |
Texture contrast at 3 to < 30 cm (shallow sandy duplexes): Acid shallow duplex; Alkaline grey shallow sandy duplex; Yellow/brown shallow sandy duplex; Red shallow sandy duplex Texture contrast at 30 to 80 cm (deep sandy duplexes): Alkaline grey deep sandy duplex; Grey deep sandy duplex; Yellow/brown deep sandy duplex; Red deep sandy duplex; Reticulite deep sandy duplex |
| Shallow sands | Sand (< 80 cm) over rock or hardpan | Calcareous shallow sand; Pale shallow sand; Red shallow sand; Yellow/brown shallow sand |
| Deep sands | Sands > 80 cm depth | Calcareous deep sand; Yellow deep sand; Brown deep sand; Red deep sand; Gravelly pale deep sand; Pale deep sand |
| Sandy earths | Sandy surface, grading to loam (or clay) at depth | Acid yellow sandy earth; Yellow sandy earth; Brown sandy earth; Red sandy earth; Pale sandy earth |
| Loamy duplexes | Loam surface and texture contrast at between 3 – 80 cm |
Texture contrast at 3 to < 30 cm (shallow loamy duplexes): Acid shallow duplex; Alkaline grey shallow loamy duplex; Grey shallow loamy duplex; Yellow/brown shallow loamy duplex; Alkaline red shallow loamy duplex; Red shallow loamy duplex Texture contrast at 30 to 80 cm (deep loamy duplexes): Red deep loamy duplex; Brown deep loamy duplex |
| Shallow loams | Loam < 80 cm over rock or hardpan | Calcareous shallow loam; Red-brown hardpan shallow loam; Red shallow loam |
| Loamy earths | Loam surface, either throughout or grading to clay | Calcareous loamy earth; Yellow loamy earth; Red loamy earth; Friable red/brown loamy earth; Brown loamy earth |
| Cracking clays | Clay surface at least 30 cm thick, crack when dry | Self-mulching cracking clay; Hard cracking clay |
| Non-cracking clays | Clay surface at least 30 cm thick, don’t crack when dry | Red/brown non-cracking clay; Grey non-cracking clay |
| Miscellaneous soils | Other | Disturbed land; Water; No suitable Group; Undifferentiated soils |
Schoknecht, N R, and Pathan, S. (2013), Soil groups of Western Australia: a simple guide to the main soils of Western Australia (4th edn). Department of Primary Industries and Regional Development, Western Australia, Perth. Report 380. [online]
Further reading
Publication Soil groups of Western Australia: a simple guide to the main soils of Western Australia (4th edn)
Noel R. Schoknecht and Shahab Pathan, Department of Primary Industries and Regional Development (2013)
MySoil
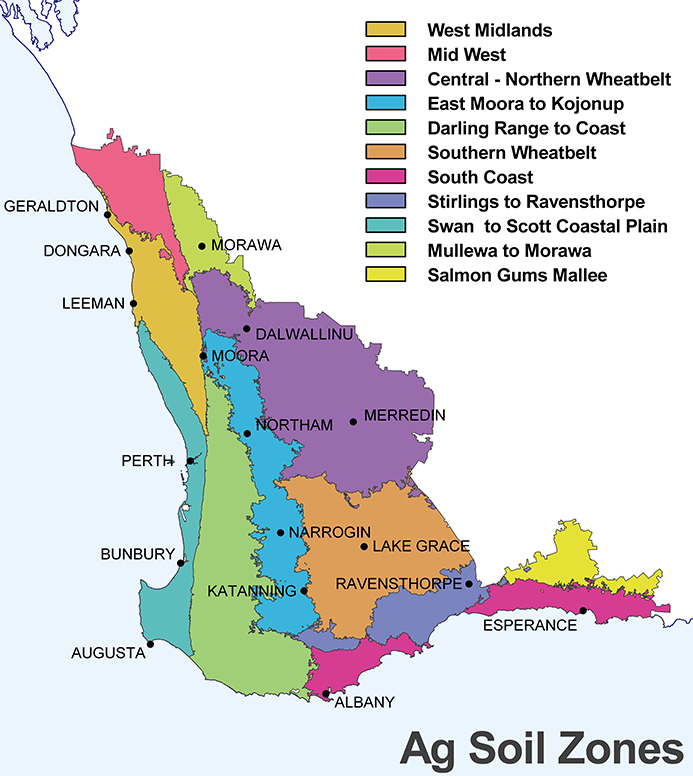
DPIRD has simplified the 60 WA soil groups in to 18 Agricultural Soils (Ag Soils). These are functional soil classes with broad management similarities based on similar plant available water capacity. Three Ag Soils considered to have limited agricultural potential (bare rock, calcareous coastal sands and self-mulching clays) were excluded from the MySoil online diagnostic tool for common agricultural soils.
The DPIRD MySoils online diagnostic tool indicates possible soil constraints associated with particular soil types and can assist with determining your most likely soil type based on geographical location and easily observed soil characteristics.
Soils are identified by first selecting a geographical area, then narrowing down the choices of soil type based on surface texture, colour, presence of stones or rocks, texture change and pH.
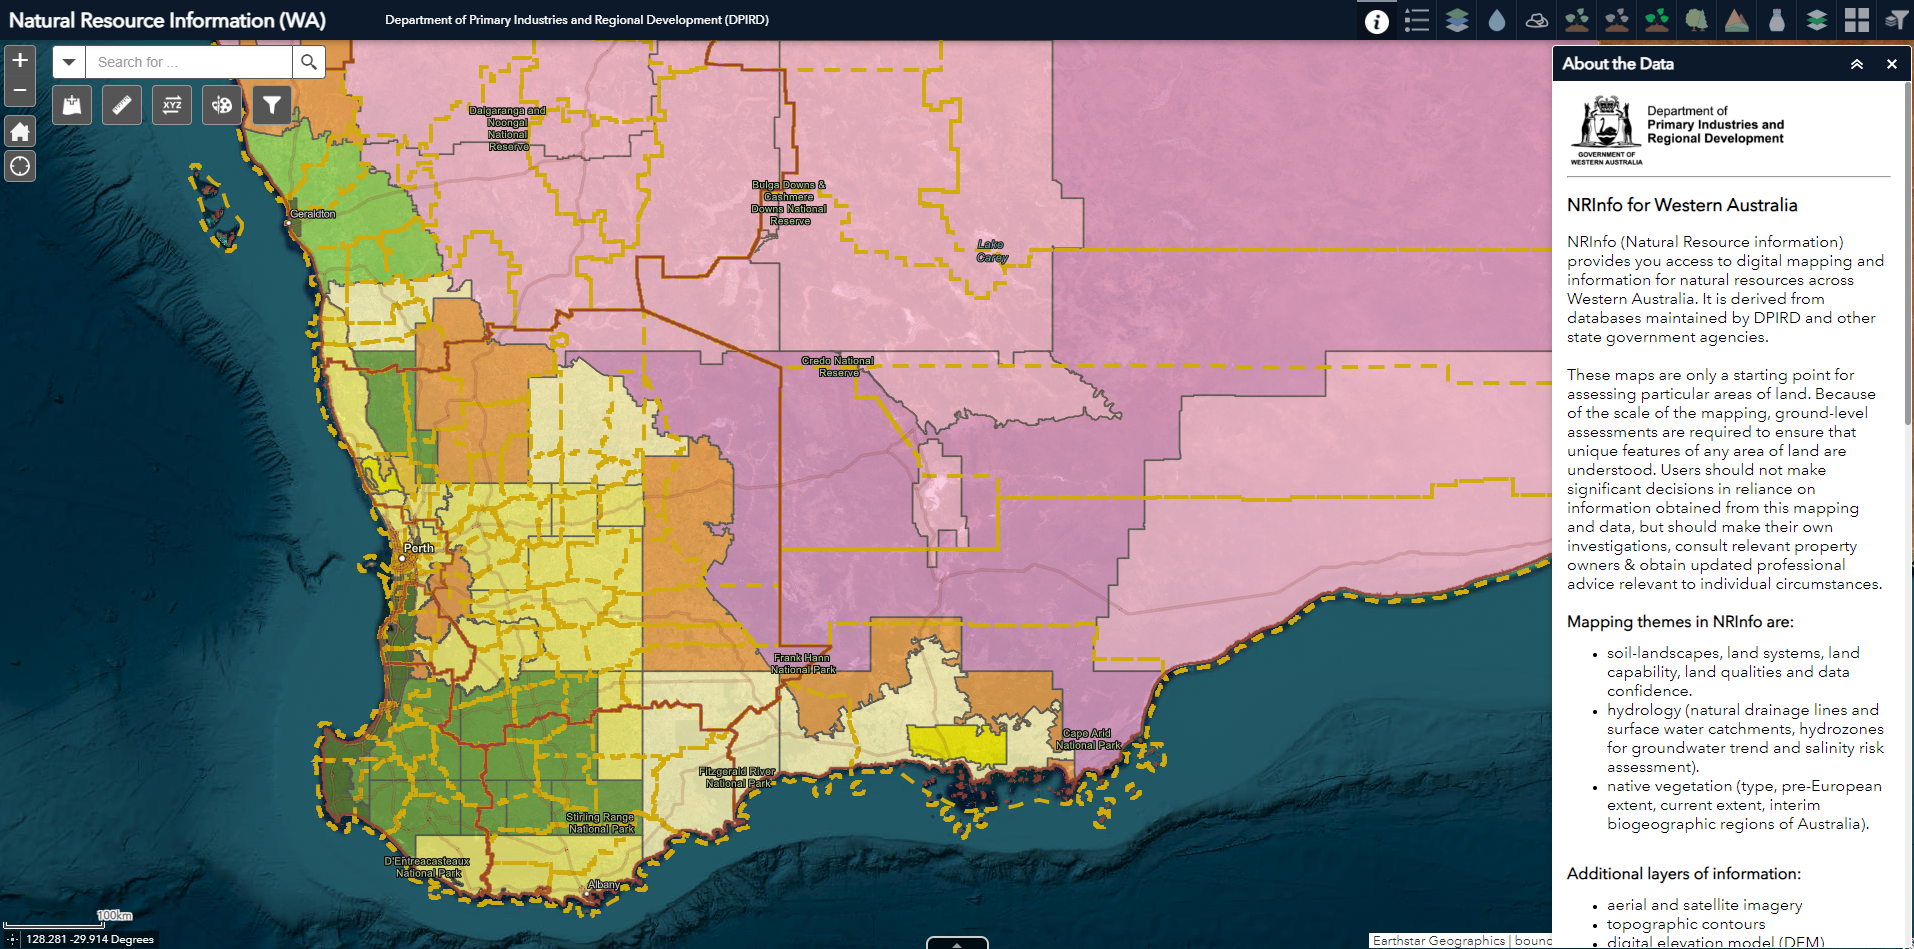
MySoil is a broad communication tool; for more specific mapping and correlation of soils related to management and crop yields, information is available from detailed sources such as DPIRD’s NRInfo (natural resource information) web page.
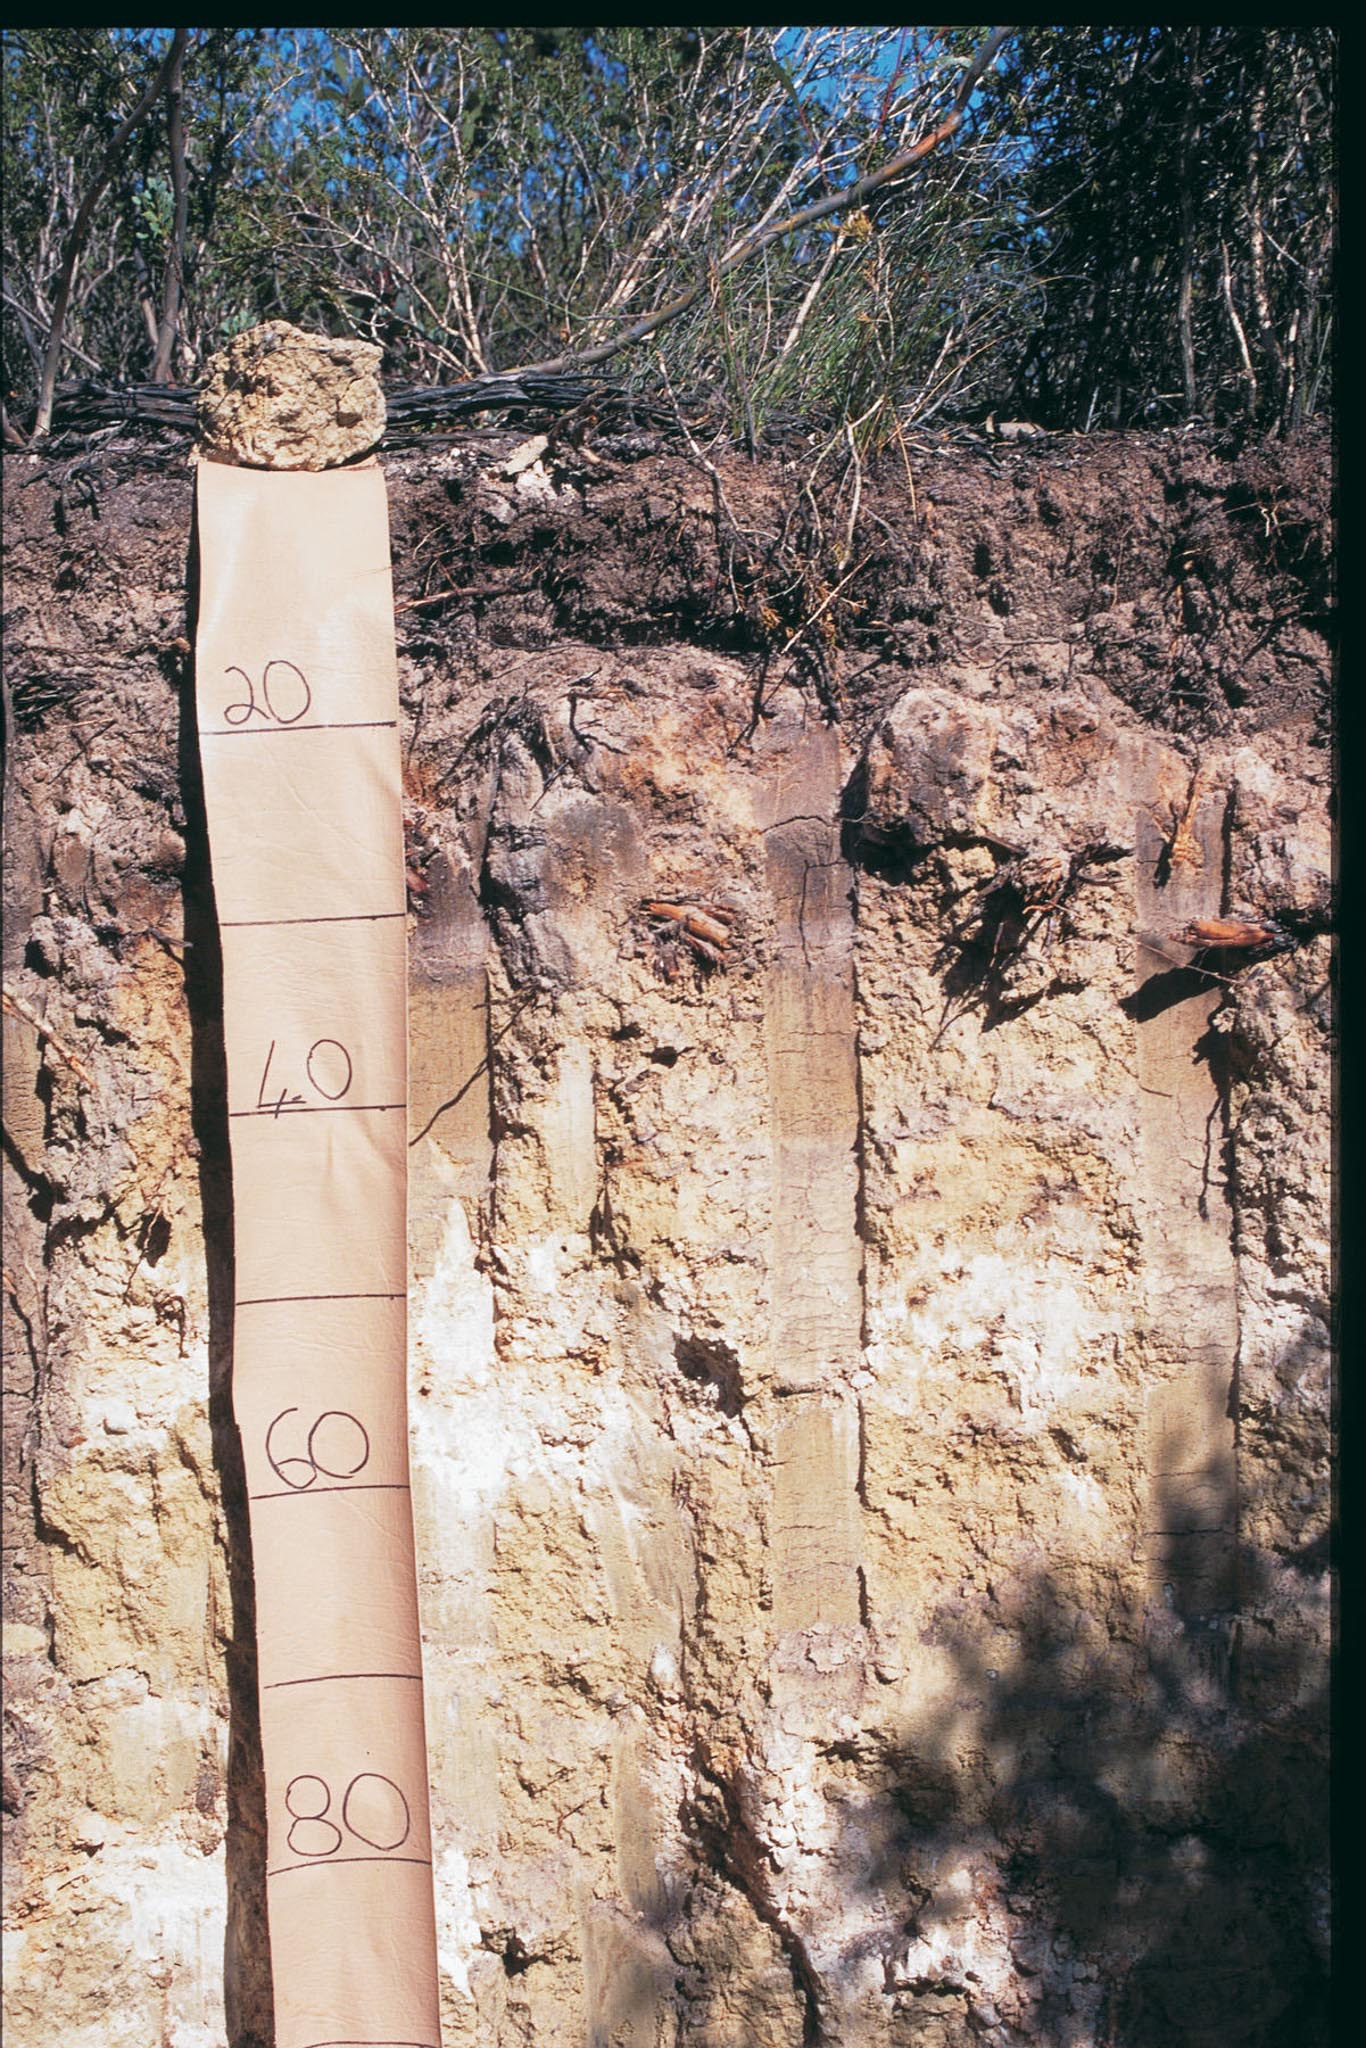
Features of a soil type
Water, changing temperatures, and chemical reactions decompose rock to form the basic soil materials – sand, silt and clay. The various layers in a soil (topsoil, subsoil, parent material) form the A, B and C horizons of the soil profile respectively, and result from the way in which the ‘parent material’ has changed under the influence of weather, vegetation and management. Many factors affect this development, including the age of the soil, climate, slope, type of parent rock, vegetation and soil movement. In many Australian soils, materials deposited by wind or water have built up over thousands of years, and have subsequently been changed further by wind and weathering. Weathering may be physical (cracking caused by heating and cooling), chemical (leaching weak acid formed by dissolved CO2) or biological (the action of roots). Sandy materials may originate from granite or sandstone, and clays from basalt or shale. For other soils the layers may reflect a past history of erosion and deposition (by wind or water) or major events such a lava flow from volcanic activity.
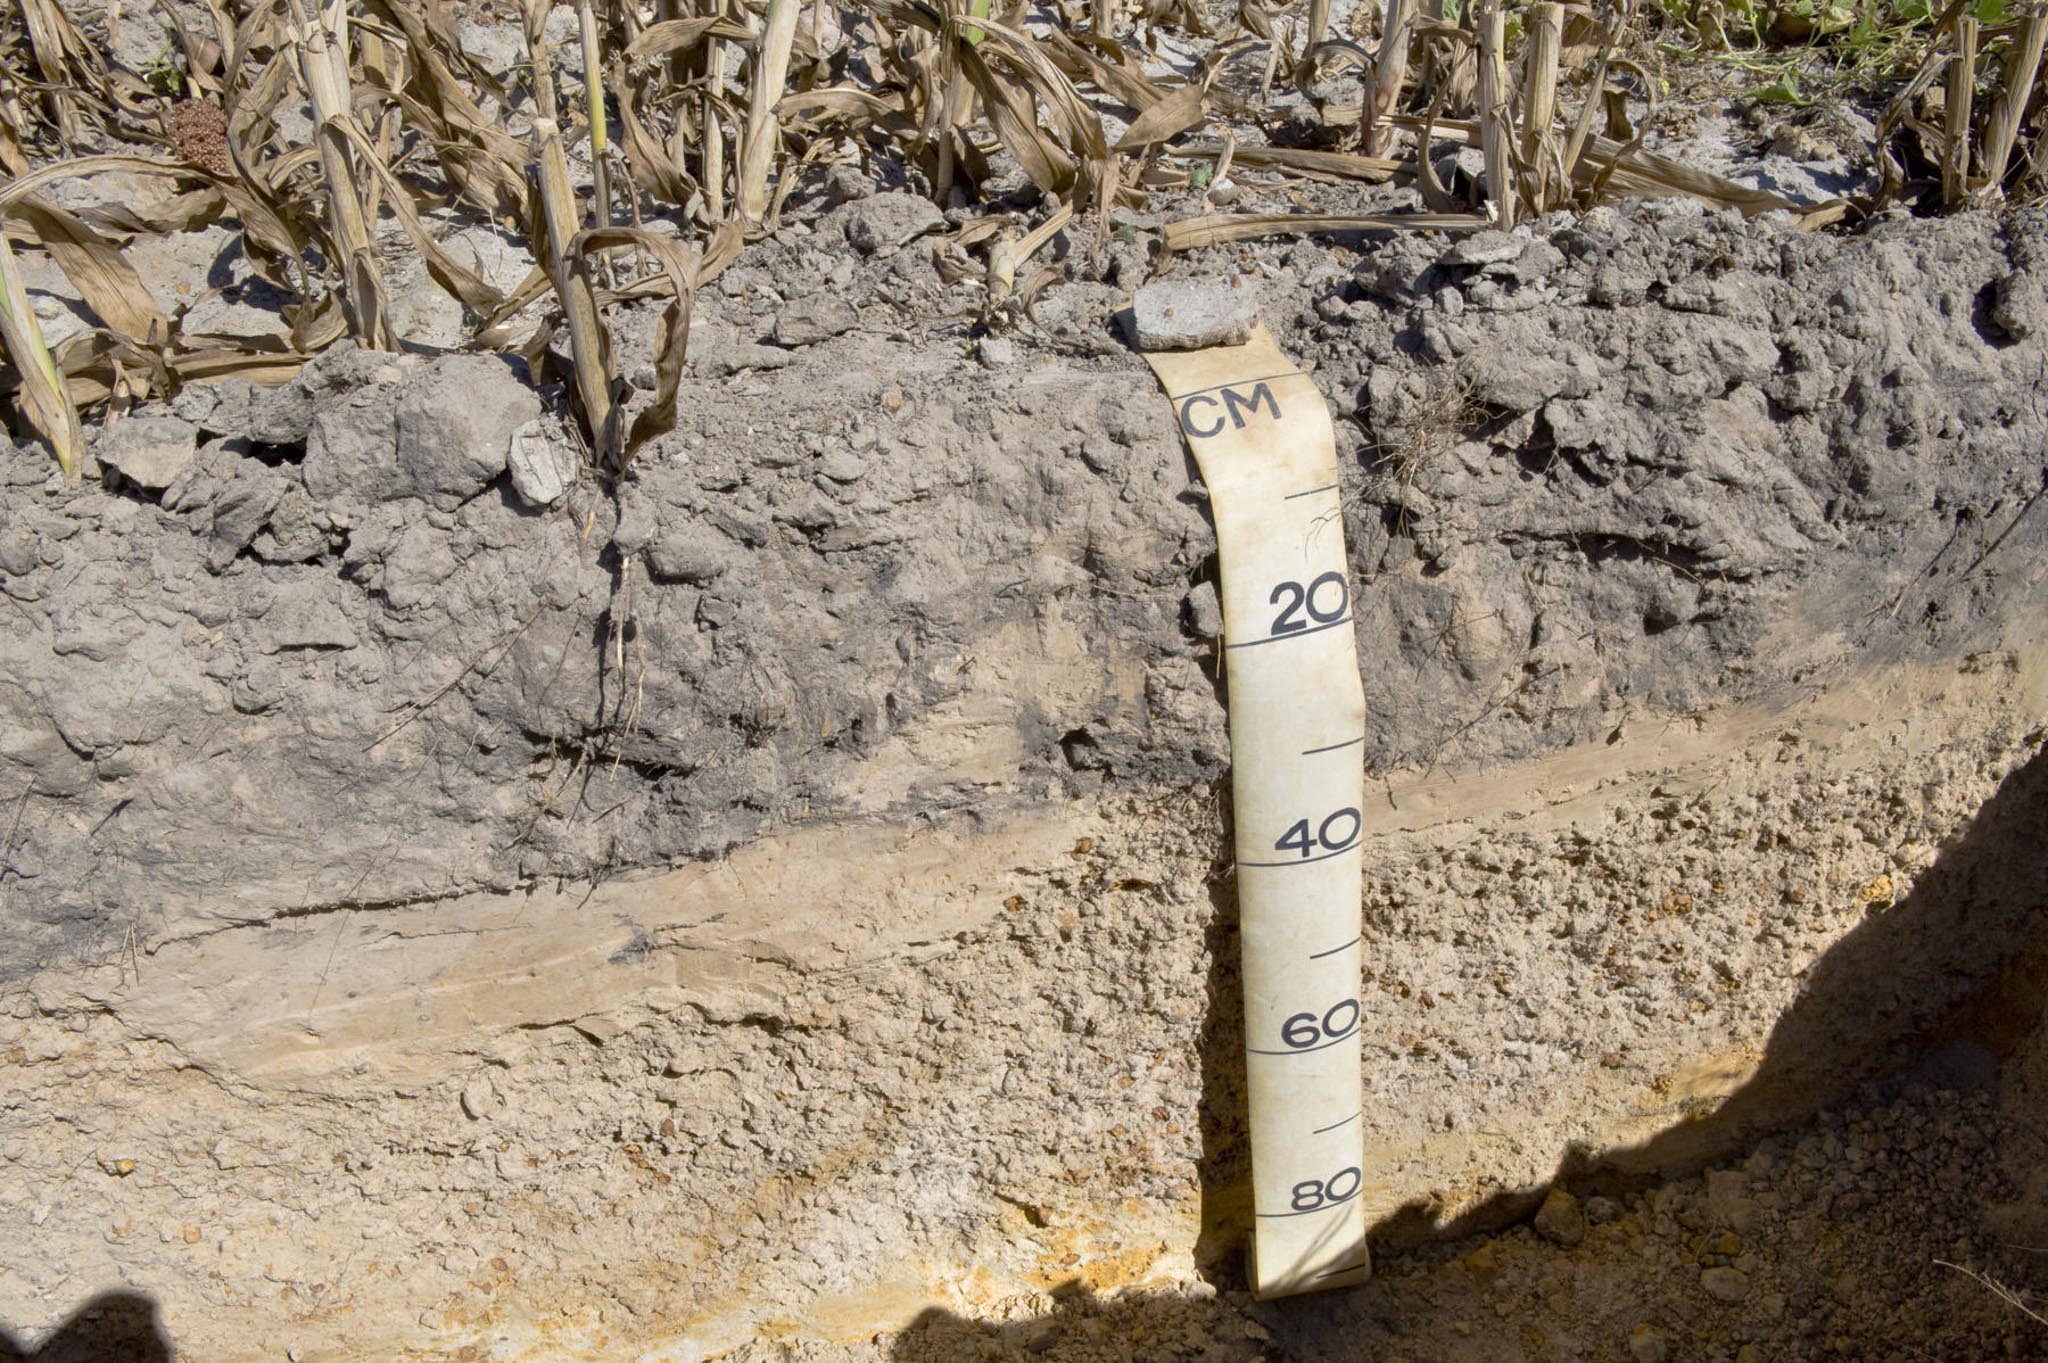
Optimally, soil profiles should be described for those layers where roots are able to grow and take up water and nutrients (the effective rooting depth). The rooting depth of most agricultural plants will normally extend beyond the top 10 cm and frequently extend below 1 m. It is important to understand not only the features of the topsoil, but also the subsoil layers which contribute significantly to water (and sometimes nutrient) supply, and hence production.
The topsoil or ‘A’ horizon is the uppermost part of a soil (often the cultivated layer) and contains the majority of organic matter, plant available nutrients and soil organisms. The depth of this layer can vary and is influenced by management and climate.
The subsoil or ‘B’ horizon often differs from the A horizon in colour, texture and structure, and can be relatively infertile. Material in this horizon predominantly results from leaching processes, as influenced by soil porosity and rainfall. In many soils, the B horizon contains higher amounts of clay than the A horizon, and the depth and water holding capacity of this horizon greatly affect the value of the soil for plant growth.
The C horizon is parent material (rock, partly decomposed rock or soil materials deposited many thousands of years ago). If the soil is shallow and the C horizon is rock, plant roots cannot penetrate and growth is restricted. In weathered (decomposed) rock, plant roots can generally find their way down through the cracks and crevices.
Not all horizons are present in every soil. For example, in ‘newer’ soil or under limited rainfall, the B horizon may not yet have developed, restricting the storage of plant nutrients and moisture. This compares to a soil with adequate depth and structure in the A and B horizons capable of storing sufficient water and nutrients for plant growth, making the C horizon effectively redundant.
The proportions of sand, silt and clay particles in the soil determine soil texture. Soil texture affects the physical properties of soil, and in particular the storage of air and water, soil organic matter content, transmission of water and nutrients, ease of root growth, workability and resistance to erosion.
Soil texture measures the relative proportion of sand, silt, clay and organic matter in soil. Texturing by hand can help identify the dominant particle type. If clay is dominant it will feel sticky, if silt is dominant it will feel very smooth, and if sand is dominant it will feel gritty. By measuring how strongly the soil sticks together when you manipulate (ribbon) it can help determine the amount of clay there is in the soil by the level of cohesion. Texture is usually directly related to water-holding ability with water holding increasing with clay content.
Sand particles are the largest (2.0 – 0.02 mm), silt intermediate (0.02 – 0.002 mm) and clay is the smallest (< 0.002 mm). The proportion of sand, silt and clay varies from one soil to another influencing the soil’s characteristics. Soil may also contain fragments of rock, or stones which comprise the gravel component.
In most soils, changes in soil texture occur with increasing depth. These layers may have either a sharp or gradual change in textural or permeability contrast (i.e. sand over clay).
Soil texture can be assessed in the field by kneading a small ball of moist soil and pressing between fingers to form a ribbon. The feel of the soil ball and the length of the ribbon indicate the texture grade.
Mineral and organic matter determine soil colour. Iron and aluminium oxides form during the breakdown of parent material and remain in the upper part of the profile, contributing to soil colour (these can be leached in very high rainfall areas) – producing red, yellow, grey and bluish-grey colours. Soil colour is easily observable and can be described in general terms, for example brown, yellow, red, grey and black.
Organic matter imparts a brown colour to the soil. Humus, the final stage in the breakdown of organic matter, as well as charcoal derived from past fires, is black. Therefore, a soil high in organic matter may be brown to black depending on the amount of humus. Organic matter build up in white sand can be seen by a greying in the top 20 cm. Dark colours near the soil surface usually indicate high concentrations of organic matter.
Soil colour can be modified through soil management and drainage practices, and provides an indicator of the aeration and drainage status of the soil. For example, iron forms a yellow oxide in soil under average air and moisture conditions, changing to red in soils which are better drained or drier, and a grey, green, or bluish-grey and often mottled colour in waterlogged soils where air is lacking. Soil mottling (spots, streaks of colours contrasting with the dominant soil colour) is caused by changes in the distribution, concentration and state of oxidation of iron compounds. By contrast, soils with good internal drainage and aeration tend to have a rusty-red colour without mottling.
Bleached horizons in a soil profile indicate leaching of iron compounds made more soluble by waterlogged conditions, which may re-appear as ‘thin ironpan’ horizons (20-30 mm thick bands of sand cemented by materials that contain iron and manganese) deeper in the profile.
Soil colour can be objectively assessed by comparing the colour of a freshly broken surface of moist soil with the standard Munsell Soil Colour Charts.
Chemical, physical and biological characteristics also contribute to the soil group and description of a soil. Each soil horizon can be defined by changes in these properties, as well as those listed above. Each horizon defined by texture or colour changes should be tested separately for their chemical properties to describe the chemical attributes of the soil profile. This may differ to soil testing for agronomic purposes.
Chemical
- pH at each soil horizon is important – acidic, neutral or alkaline
- Presence of carbonates and other
- Electrical conductivity (EC) is an indication of salinity
- Cation exchange capacity can indicate the fertility of the soil
- Sodicity – an aggregate test can be done in the field but a lab method of the exchangeable sodium percentage (ESP) supports the description
Physical
- The surface of the soil is observed – such as whether soil water repellence is present or if there is any surface crusting
- The structure of the soil horizons indicates the water movement and drainage which has implications to root growth. Structural issues can be caused by the soil chemistry and well as physical.
- Whether the soil is saturated and the annual duration of this
Biological
- The depth of the organic matter layer and the location of any organic matter layers are important observations
- The depth of roots, any evidence of soil biology such as pores, castings, hyphae, aggregation etc.
Hot humid climates with high rainfall produce a greater depth of soil because of the rapid decomposition of the parent rock and organic matter. However, due to leaching of nutrients this soil can be relatively infertile. Cold climates slow the weathering process and often have rocky landscapes with shallow soil. In dry climates, the formation of soil is also slow.
Further reading
Publication A simple guide for describing soils
Angela Stuart-Street, Nicolyn Short Dr, Paul Galloway, Noel R. Schoknecht, Department of Primary Industries and Regional Development (2020)
Video examples describing soil profiles
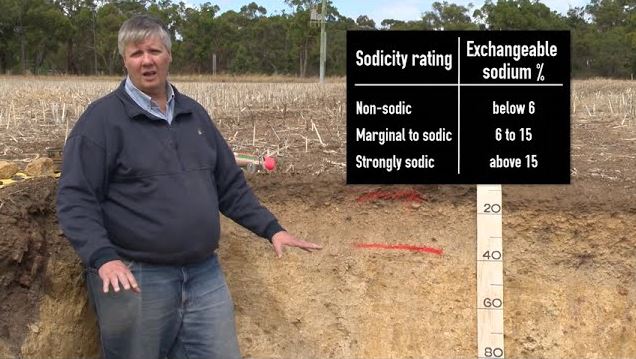
Examination of a gravelly duplex soil (Chromosol)
From Soil Quality: 1 Constraints to Plant Production (Murphy et al. 2017). Video talent: Tim Overheu, DPIRD; video production: Lomax Media.
Soil testing
A single soil sample at a point in time can only be a snapshot of the soil condition and will be influenced by variables such as where and when the sample was taken, how much soil was collected from how many sites, soil moisture, depth intervals and how well it is mixed. As a rule it should be as representative of the site as possible.
Nutrient values can be compared against critical soil test values for plant production to help with fertiliser recommendations. A comparison of your soil condition to the local or wider area is possible using the soilquality.org.au website, with a simple traffic light system that allows you to identify current or developing soil constraints. Trends in soil parameters over time are of even greater value and can be used to evaluate the success of management practices such as liming for soil acidity. However, careful sampling from the same locations and accurate record keeping over time are necessary to be able to interpret trends with confidence.
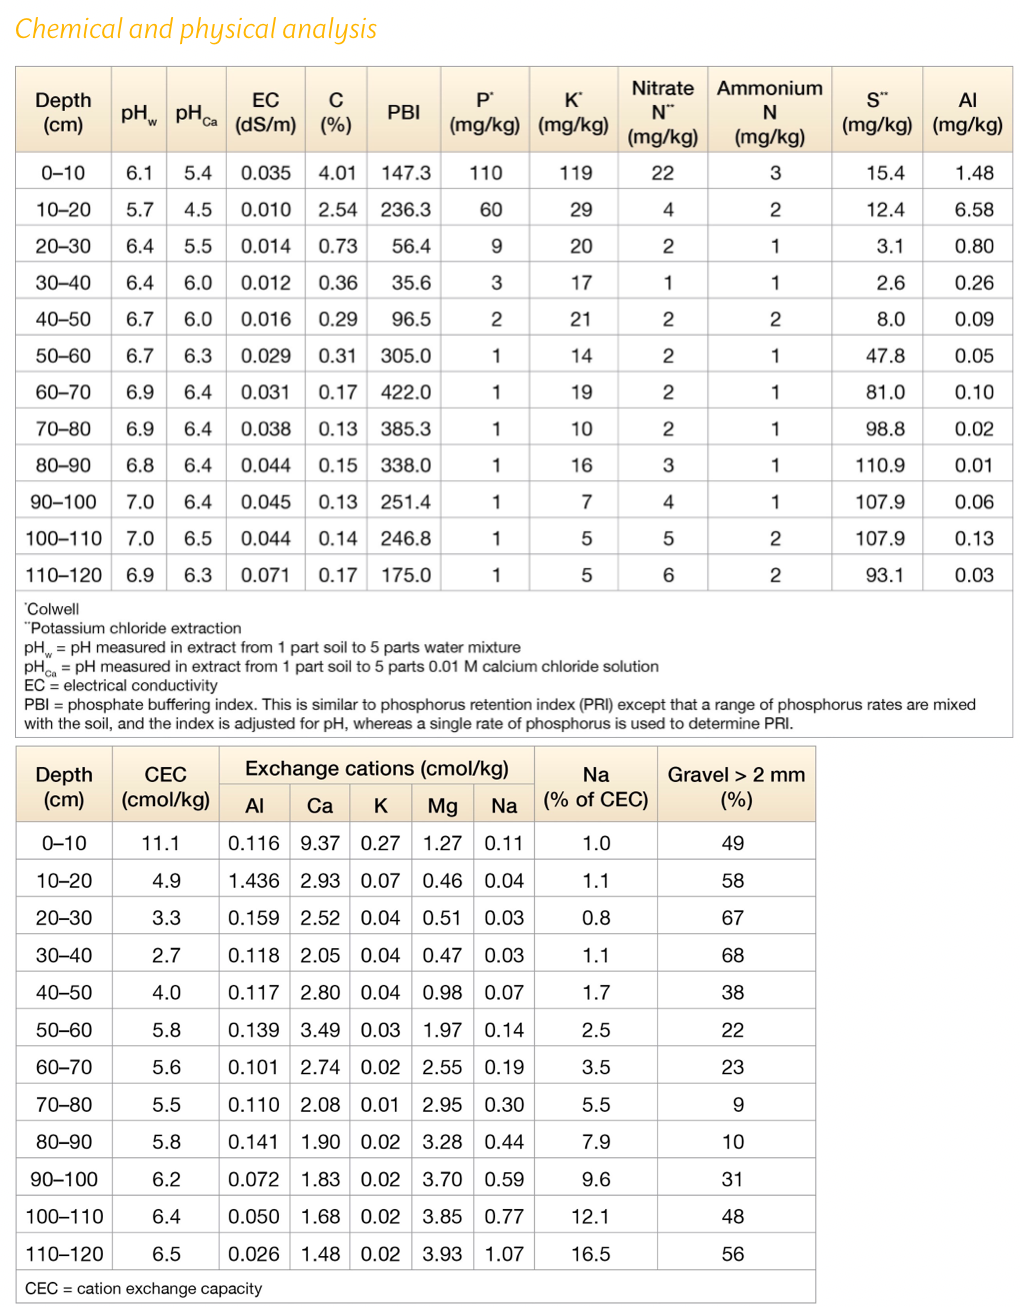
Soil test results
Samples were sieved to determine the gravel fraction greater than 2 mm. All other analysis were conducted on the less than 2 mm fraction.

Examination of a sandy duplex soil (Chromosol)
From Soil Quality: 1 Constraints to Plant Production (Murphy et al. 2017). Video talent: Matthias Leopold, The University of Western Australia; video production: Lomax Media.
Soil testing
A single soil sample at a point in time can only be a snapshot of the soil condition and will be influenced by variables such as where and when the sample was taken, how much soil was collected from how many sites, soil moisture, depth intervals and how well it is mixed. As a rule it should be as representative of the site as possible.
Nutrient values can be compared against critical soil test values for plant production to help with fertiliser recommendations. A comparison of your soil condition to the local or wider area is possible using the soilquality.org.au website, with a simple traffic light system that allows you to identify current or developing soil constraints. Trends in soil parameters over time are of even greater value and can be used to evaluate the success of management practices such as liming for soil acidity. However, careful sampling from the same locations and accurate record keeping over time are necessary to be able to interpret trends with confidence.
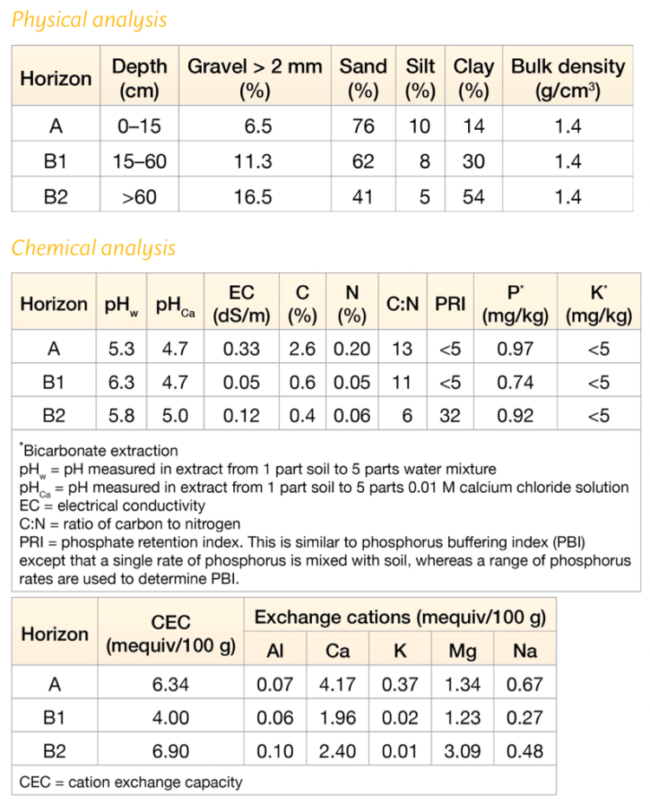
Soil test results
Samples were sieved to determine the gravel fraction greater than 2 mm. All other analysis were conducted on the less than 2 mm fraction.
These soil test results are typical of a sandy duplex, Chromosol, soil. The soil physical and chemical characteristics are a function of the soil type and age, with influence from agricultural practices. Nutrient status and pH in the A and B1 horizons are largely dependent on rotational history and lime and fertiliser regimes. Root growth for agricultural crops are largely restricted to the upper 60 cm, nutrients and water stored in the compacted, clay-rich, B2 horizon are mostly not accessible for crops.
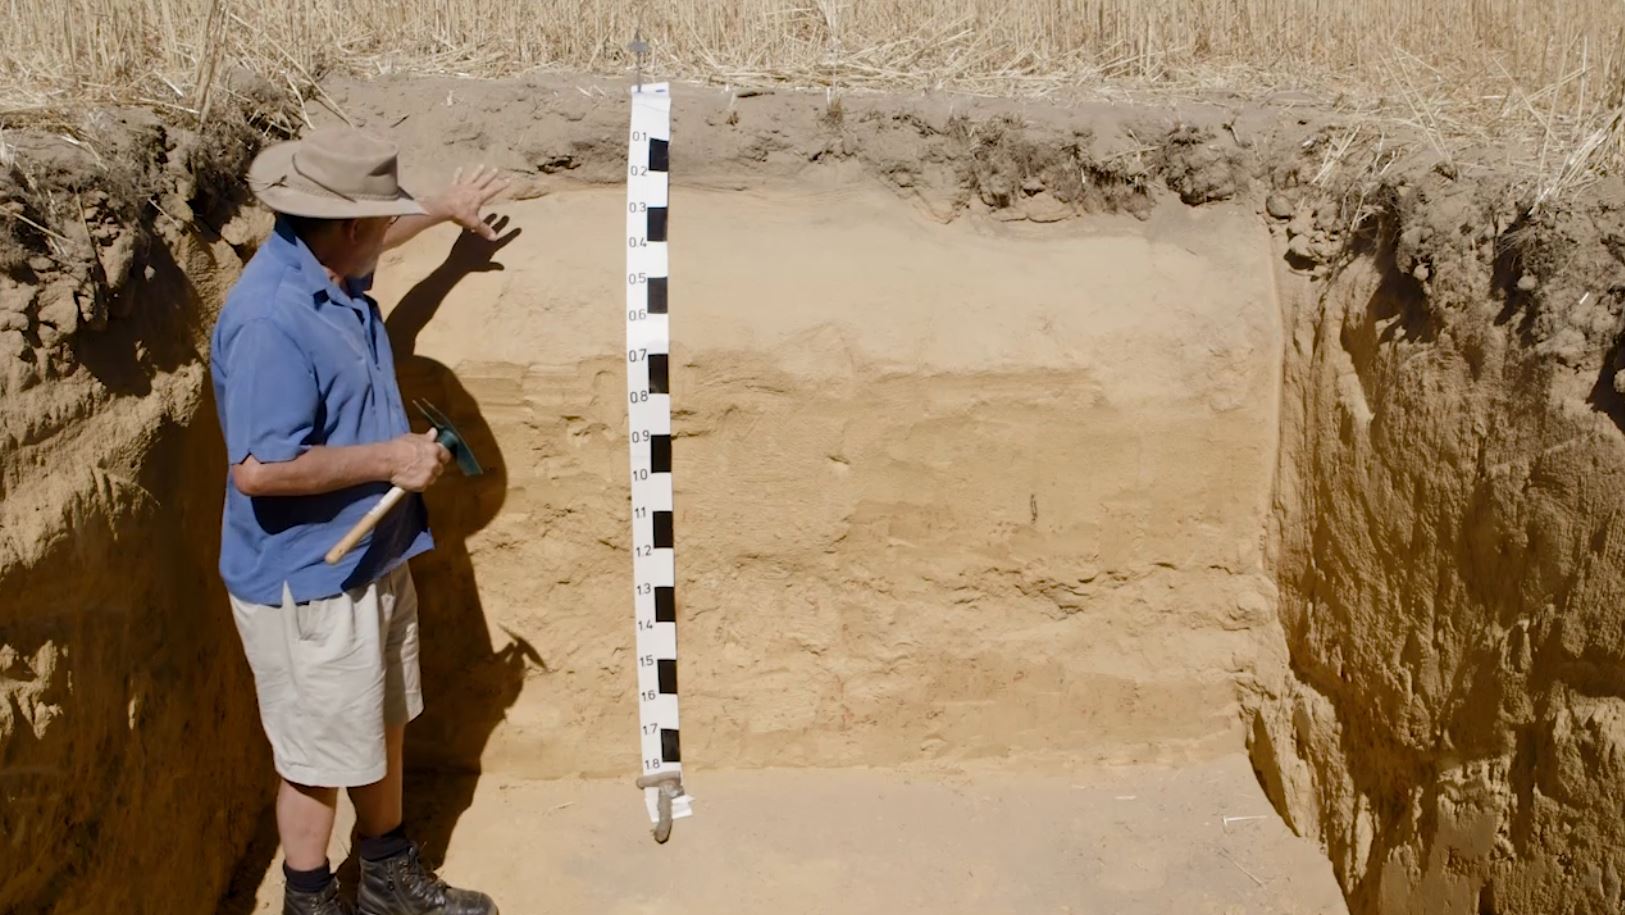
Examination of a deep sandy soil (Arenosol)
From Soil Quality: 1 Constraints to Plant Production (Murphy et al. 2017). Video: Paul Blackwell, formally DPIRD.
Soil testing
A single soil sample at a point in time can only be a snapshot of the soil condition and will be influenced by variables such as where and when the sample was taken, how much soil was collected from how many sites, soil moisture, depth intervals and how well it is mixed. As a rule it should be as representative of the site as possible.
Nutrient values can be compared against critical soil test values for plant production to help with fertiliser recommendations. A comparison of your soil condition to the local or wider area is possible using the soilquality.org.au website, with a simple traffic light system that allows you to identify current or developing soil constraints. Trends in soil parameters over time are of even greater value and can be used to evaluate the success of management practices such as liming for soil acidity. However, careful sampling from the same locations and accurate record keeping over time are necessary to be able to interpret trends with confidence.
Soil test results
Samples were sieved to determine the gravel fraction greater than 2 mm. All other analysis were conducted on the less than 2 mm fraction.


Page references and acknowledgements
Material on this page adapted from:
- Hoyle FC (2007). Soil Health Knowledge Bank.
- Murphy D, Leopold M, van Gool D, Hoyle FC and Stockdale E (2017). Soil Quality: 1 Constraints to Plant Production. SoilsWest, Perth, Western Australia. [Access]
Additional reference/s:
- Isbell RF and the National Committee on Soil and Terrain (2021). The Australian Soil Classification (3rd edn). CSIRO Publishing. [Available online at Soil Science Australia]
- Schoknecht NR and Pathan S (2013). Soil groups of Western Australia: a simple guide to the main soils of Western Australia (4th edn). Department of Primary Industries and Regional Development. [Access]
Last updated July 2024.