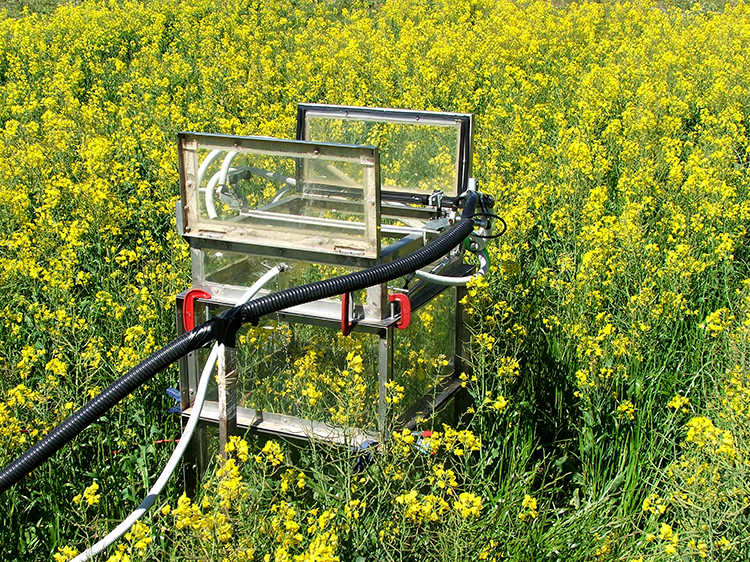
Interpreting and understanding replicated trial results is not always easy.
The replication of treatments a number of times across a trial gives some level of confidence that the results measured are indeed a result of the treatments applied and not the result of natural random variation or the cause of another factor that may have not been previously considered as an influence on the results. Trials range from replicated small-plot field research through to on-farm experimentation using farm machinery. A suitable trial design provides a more reliability in the results from the experiment.
Replicated trials
In designing a trial, the first thing to determine is ‘what is the research question’. It can be tempting to test many practices all at once, but by keeping the question as simple as possible makes it easier to design a trial that can be interpreted. Once the research question has been narrowed down, the treatments can be designed that best address that research question, or hypothesis.
A ‘treatment‘ is each type of experimental condition that is being compared. A ‘nil‘ or a ‘control‘ treatment can sometimes be the same thing, or sometimes they might be different. A ‘control’ treatment generally means the status quo or without doing anything different. This could be farmer practice, as an example. The ‘nil’ may be the same in some cases, or it could be no inputs at all, such as omitting fertilisers in a trial testing different rates. The control is what all other treatments are compared to in the first instance.
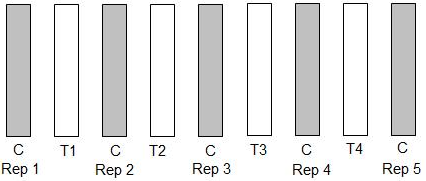
Replication in trials means repeating the treatments multiple times. The purpose of replication is to give more confidence that the result is not a once-off or caused by some other variable. Each replication of treatments becomes a ‘block‘. The minimum number of replications can be dependent on the size and number of treatments being considered, but three replicates is generally the minimum number required to provide some level of confidence in the results and thus in their use to guide decisions. Whole paddock treatments, single plots or across the fence comparisons can be misleading, and results may in fact reflect a poor choice of site, changing soil type, differences in management or even preferential grazing by kangaroos. By comparison, if the yield response of a treatment replicated a number of times is consistently higher than other treatments, then it can be concluded with a greater degree of confidence that this response was related to the treatment applied.
One big influence in field experiments is the variability of a site. Choosing a location with as minimal amount of variation is essential for a quality trial. When it comes to analysing the trial, the variability can be too large an influence to determine the treatment effects. One way to manage this is to try to contain any variability that might be at a site within each block. Another way this is managed is through the randomisation of treatments across the trial. Randomisation means the order of treatments across the trial and within each block. Think of it like a mosaic, you want to make sure that there aren’t any influences that might be affecting one treatment over another. Some causes of bias to an experiment could be slope, orientation, edge effects of adjacent treatments or bare ground, header rows or other issues such as weeds, soil variability, depth to gravel, seeding direction, historic management and so on. The replication of treatments a number of times across a trial gives some level of confidence that the results measured are indeed a result of the treatments applied and not the result of natural random variation or other unmeasured influence. This random and unaccounted for variation contribute to the ‘error term’ in the statistical analysis of results.
Understanding statistical analysis
Statistical analyses are used to make sense of information collected about treatments or variables. It is more accurate to compare and understand a treatment response when using the average, rather than several individual yield measurements. When comparing various treatments or factors to see if they influence the measured responses of interest, the variability of the measurements needs to be taken into account.
For example, consider yield averages from a simple trial with a single treatment and a control replicated three times in a paddock. If the individual yield measurements making up the averages are all close values, yield differences are likely due to the treatment. If the values vary widely, the differences are just part of the natural variability in the paddock. To know whether the variability is low enough to say that the differences are due to the treatment, we apply statistical analyses.
Statistical analyses provide a probability, or likelihood that the difference between the treatment and the control is a true difference (not just part of the natural variability in the paddock). When the probability is 95% we usually conclude that the differences result from the treatment.
Different approaches can be taken to field trials so it is always a good idea to seek some advice before you start. You can analyse your own data using a spreadsheet program such as Excel. If you are not confident in analysing your own data, it is advisable to seek help from your agricultural consultant. Below is some terminology and abbreviations you are likely to come across.
Number (n)
This is the number of observations or measures.
Replicate
This is the number of replicates (or repeats) for each level of treatment in an experiment. As replicate number increases, there is a greater account of random variability and your result is more likely to reflect a true response.
Variable
A variable is any characteristic, number or quantity that can be measured or counted. Variables may change in value over time, space or population. Variables can be independent (for example, site, variety, time of sowing) or response variables (for example, soil pH, organic carbon, yield).
Mean (M, x̄); Average
The mean is the average of a range of data for a single variable. It is the sum of the values, divided by the total number of observations.
Standard deviation (SD, σ)
The standard deviation is a measure of variation in a frequency distribution. It measures how scattered the data in a certain collection are around the mean. A low standard deviation means that the data are tightly clustered; a high standard deviation means that they are widely scattered.
Coefficient of variation (CV)
The ratio of the standard deviation to the mean. A lower CV means the data within the trial are less variable and more confidence in the means.
Distribution
The distribution of a variable is a description of all the data values and the number of times each possible outcome occurs. A ‘normally’ distributed data set, also known as the bell-shaped curve, has data primarily within one standard deviation of the mean.
Confidence interval (CI)
A confidence interval is used to express the degree of uncertainty associated with a sample statistic. A confidence interval measures the probability that a population parameter will fall between two set values. The most common confidence intervals used are 95% or 99%.
Outliers
An outlier is an observation that lies outside the overall pattern of a distribution, or an abnormal distance from other values in a random sample from a population. An easy way to spot outliers is with the use of scatter diagrams or a histogram. Outliers can only be omitted from statistical analysis if there is a good reason do so, for example if sheep got into the trial and ate from one area, you could legitimately exclude results from that area.
Probability (P)
The P-value (probability value) indicates the likelihood of incorrectly finding a difference when no difference exists. A P-value of 0.01 tells us we might see a random difference only about 10 times in 1000.
t-test
The basic statistical t-test compares means from exactly two groups, such as the Control Group versus the Experimental Group. A paired t-test is normally used for ‘before’ and ‘after’ experiments when the same individuals are measured either side of a treatment being applied.
Analysis of Variance (ANOVA)
A one-way ANOVA is similar to a t-test but is based on the variance (variability) of the values in a treatment and can be used to compare differences between three or more treatments for a single variable. Separate tests are used to determine which treatments are different from the control. A two-way ANOVA allows you to compare two or more groups in response to two different independent variables.
Not significant (ns)
A statistically significant result (usually a difference) is a result that’s not attributed to chance. The level of certainty (probability) is often tested within the limits of 95% probability meaning that there is only a 5% likelihood that the result was due to chance. In trials it is possible that differences can be generated from data that is highly variable, where there is a high sampling error, high background variability or just random noise in data. In these instances a non-significant result may be generated, as there is less confidence that the change in value is the result of treatments.
Interpreting trial results
The results of replicated trials are often presented as the average (or mean) of the yields from each of the replicated treatments. Statistics are then used to compare the mean (average) treatment result to see whether any differences are larger than is likely to be caused by natural variability across the trial area (such as changing soil type). These statistical analyses indicate the probability that the yield response observed was the result of the treatment applied. An example of a replicated trial of three fertiliser treatments and a control (no fertiliser), with statistical analyses is shown in the table below.
The effect of nitrogen fertiliser rates on wheat grain yield (t/ha) on a deep sand in the low rainfall zone of Western Australia
| Treatment | Mean grain yield (t/ha) | LSD (P<0.05) = 0.26 |
|---|---|---|
| Control (nil) | 1.13 | a |
| Treatment 1 (20 kg N ha) | 1.52 | b |
| Treatment 2 (40 kg N ha) | 1.80 | c |
| Treatment 3 (60 kg N ha) | 1.65 | bc |
The least significant difference (LSD) is the amount by which two values (treatment means) must differ for them to be considered different. Commonly, the LSD is calculated using a confidence level of 95% (i.e. there is a 95% probability, or 19 times out of 20 that the difference observed is due to the treatments imposed, and not due to chance).
In this example, the statistical analysis indicates that there is a fertiliser treatment effect on yields. The LSD of 0.26 suggests each treatment mean must differ by at least this amount (260 kg/ha) to be considered different. Often, letters are used to signify which results are different. Treatment means with the same letter are not significantly different at the 95% level from each other. The treatments that do differ significantly are those followed by different letters.
In this case, the control treatment is lower yielding than all other treatments. Treatments 1 and 2 are significantly different from each other, suggesting an increasing yield response with increasing nitrogen rate. However, treatment 3 is not statistically different from either treatment 1 or 2, so that increasing the nitrogen rate from 20 or 40 to 60 kg/ha did not increase the yield. As treatment 2 does differ significantly from treatment 1, it can be concluded that 40 kg N/ha gave the highest yield in this example.
Site variability can often lead to large differences in yields from plots with the same treatment due to their different spatial location and possible changes in soil type, effects of past management or even variability in rainfall within a single paddock. Due to these differences between identical treatment plots, it becomes more difficult to determine whether real treatment differences exist. For this reason, more replicates may be needed on sites with high natural variability, and the different treatments should be applied randomly across the site to increase the likelihood of each treatment sampling the full variability of the site. This should then help ensure that differences in treatment means are not due to site effects.
On-farm experimentation
Many on-farm trials are a straightforward comparison of “A versus B”. These trials, which are easy to design and analyse, correspond to the typical experimental question “Is alternative ‘B’ better than, worse than, or the same as my customary practice ‘A’?” This approach can be used to evaluate individual practices or whole systems of practices.
Due to paddock and seasonal variability, doing an on-farm trial is more than just planting a test strip in the back paddock, or picking a few treatments and sowing some plots. You need to have confidence that any differences observed or measured (positive or negative) are real and repeatable, and due to the treatment rather than some other factor. To get the best out of your on-farm trials, keep the following points in mind:
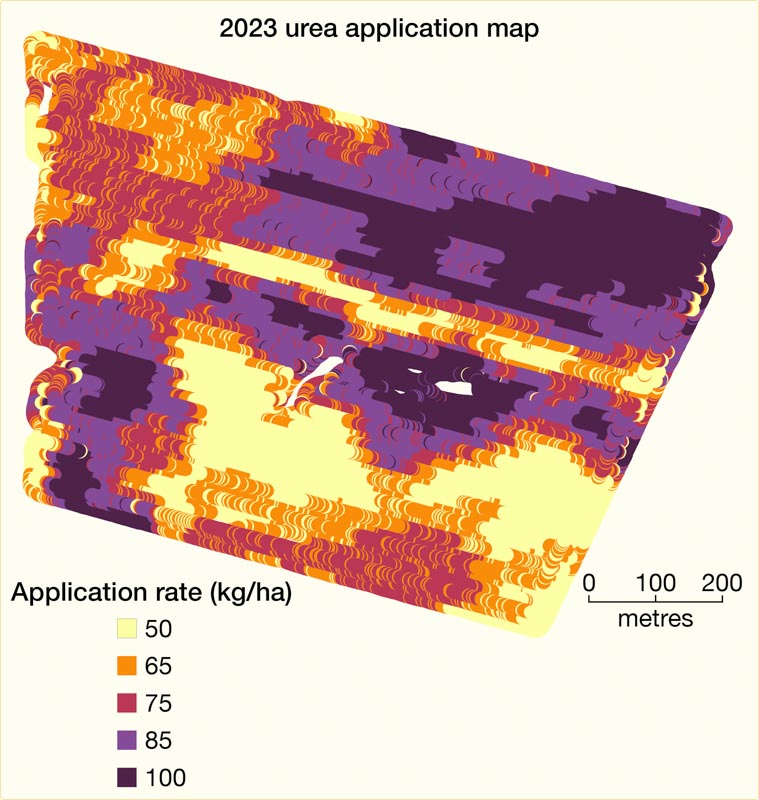
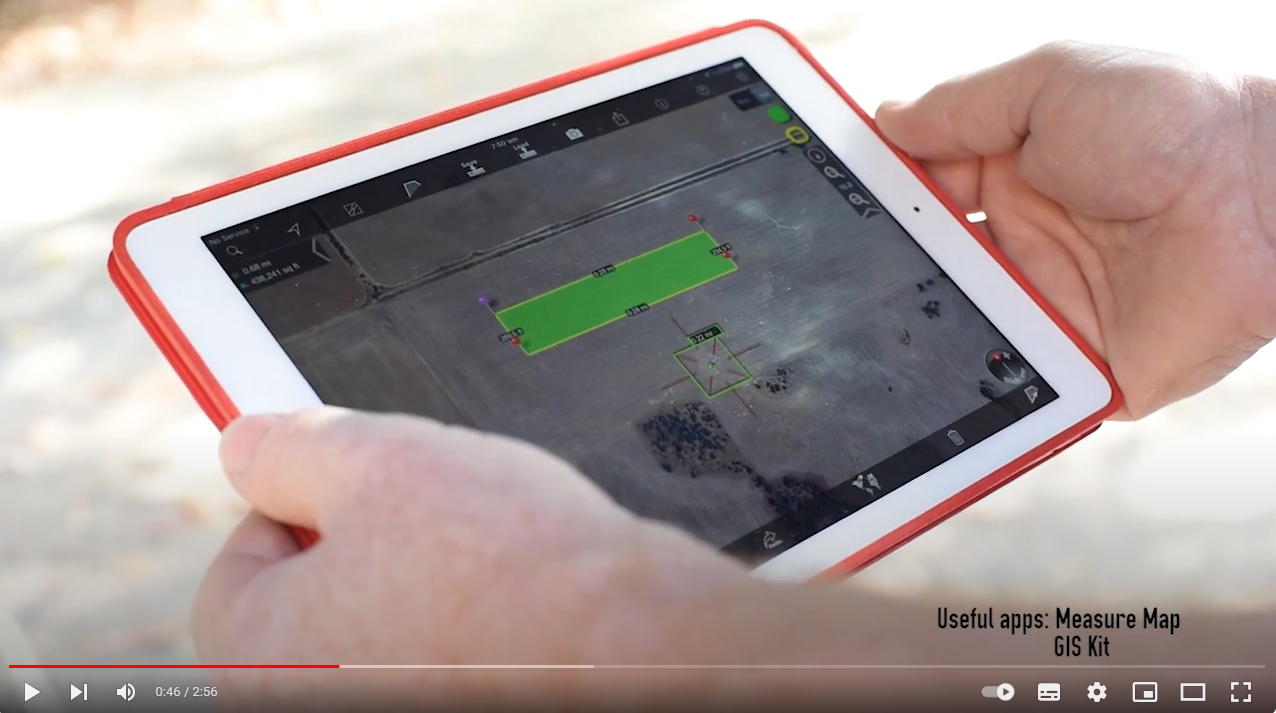
- Choose a test site that is as uniform and representative as possible — use yield or biomass imagery maps to help do this.
- Plan and select the number of treatments carefully (don’t go overboard – repetition quickly increases the total number of plots required).
- Plan what you are going to measure to confirm treatment effects.
- Make treatment areas to be compared as large as possible but allow room for control strips where possible (you need to be able to compare treatment effects against either standard practice or a ‘nil treatment’ control).
- Treat and manage areas similarly both pre and post treatment application.
- Replicated strips allow the landholder to calculate both a mean and the variance, from which it is easier to interpret on-farm results.
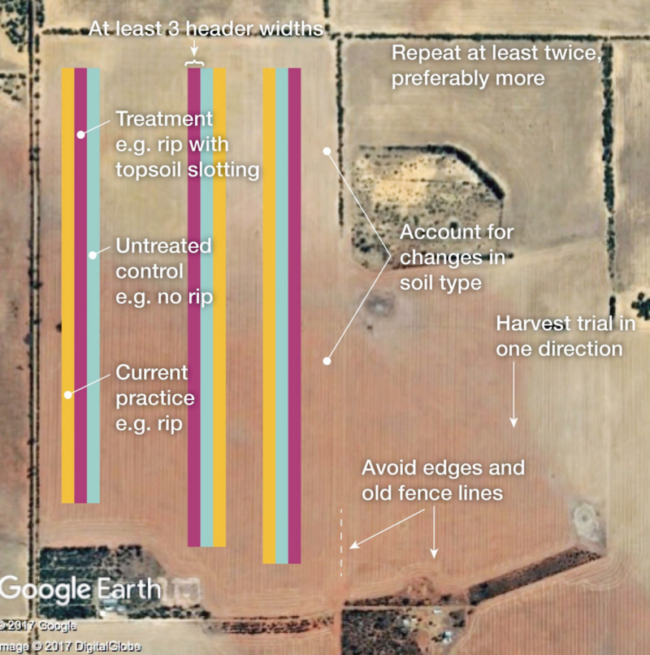
- If unable to replicate treatments as shown in the figure below (left), then an alternative is to place a control strip on both sides and in the middle of your treatment strips (see the figure on the right, below).
- If you cannot find a uniform area, either:
– Arrange the replicates as blocks so that all treatments are equally influenced by the variation across the site. That is, try to maximise the natural variation between the replicate blocks rather than between the treatments.
– Place test strips in a direction so that all treatments are equally influenced by the variation across the site. - Document any changes in soil attributes noted, such as change of soil type, and consider taking measurements from the different areas.
- Record treatment details and monitor the test strips, recording all measurements taken.
- Organise a weigh trailer or use yield mapping to more accurately assess grain yield. Yield mapping provides a useful tool for comparing large-scale treatment areas in a paddock. Plots should be at least 2-3 header widths and treatments harvested in the same direction.
- Evaluate the economics of treatments when interpreting the results.
Using precision agriculture in trials on your farm
From Soil Quality: 2 Integrated Soil Management (Pluske et al. 2018). Video talent and still images: Bindi Isbister, previously Precision Agriculture; video production: Lomax Media.
Page references and acknowledgements
Material on this page adapted from:
- Hoyle FC (2007). Soil Health Knowledge Bank.
- Pluske W, Boggs G and Leopold M (2018). Soil Quality: 2 Integrated Soil Management. SoilsWest, Perth, Western Australia. [Access]
Last updated July 2024.


