Date
2023/08/31
Duration
4 min read
ebook
Soil Quality: 10 Plant Nutrition
Organisations
Farmanco
Authors
Alice Butler
Aim: To improve the efficiency of nitrogen application using variable rate application.
Key messages
- Yield is variable due to soil type and seasonal conditions.
- Historical yield data, biomass imagery, soil test results and the grower’s knowledge were used to create the prescription map to vary top-up nitrogen.
- There has been no change to the amount of nitrogen fertiliser required for this paddock.

Background
- Location: South Stirling
- Soil type: Deep sand, sand over clay duplex
- Average annual rainfall: 600 mm
Within the case study paddock, soil pHCa ranges from 5.4–5.8 at the surface. Where there is clay at depth the pH increases, but the sandier areas generally have a soil pHCa between 4.5 and 5. Soil nitrate ranges from 3–18 milligrams per kilogram and soil organic carbon ranges from 0.6–2.0%, with the sandier zones containing the lower levels of nitrate and organic carbon.
The grower started collecting yield data in 2019. The farm contains high variability driven by soil type and seasonal conditions, with waterlogging a major issue in the high rainfall years. Due to the variability, the grower and their agronomist were keen to start applying top up nitrogen more strategically to meet yield potential of the soil type.
Data layers
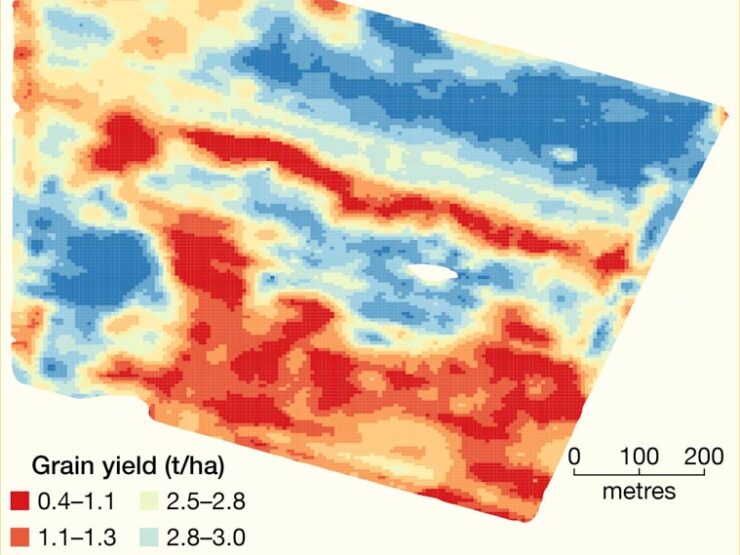
In 2020, an average rainfall year (annual – 500 mm), the paddock was sown to barley and averaged 2.5 tonnes per hectare at harvest. When comparing the 2020 barley yield map to the paddock soil types the grower felt it showed up the lighter, sandier soil types well and provided a good representation of paddock production. 2022 was a higher rainfall year (annual – 750 mm) and the paddock was sown to wheat, averaging 2.4 tonnes per hectare. The historical yield data has shown that the yield potential varies greatly across the paddock, ranging from 0.3 to 5.5 tonnes per hectare of barley in 2020, and 0.4 to 5 tonnes per hectare of wheat in 2022.
Using these two years of yield data, a multi-year cereal yield map was created by averaging the two years data understand paddock production over different seasonal conditions and cereal crop types.

The multi-year analysis provides a coefficient of variation map as well, allowing us to understand how consistent the data is over the two different years. Dark blue displays areas of high consistency over the two seasons and as consistency lowers this is reflected in lighter blue. A coefficient of variation of greater than 0.5 is reflected in red and highlights areas that varied greatly between seasons.

Variable rate strategy
In 2023, the nitrogen strategy was to apply a blanket rate for the first application and then use a variable rate strategy for the top up nitrogen. The grower and agronomist had allocated an average rate of 75 killograms per hectare of urea for top up nitrogen, and this informed the variable rate strategy. Allocation of urea was taken away from the poor areas with lower water holding capacity and given to the higher production areas where it could be better utilised, with the aim of getting closer to yield potential.
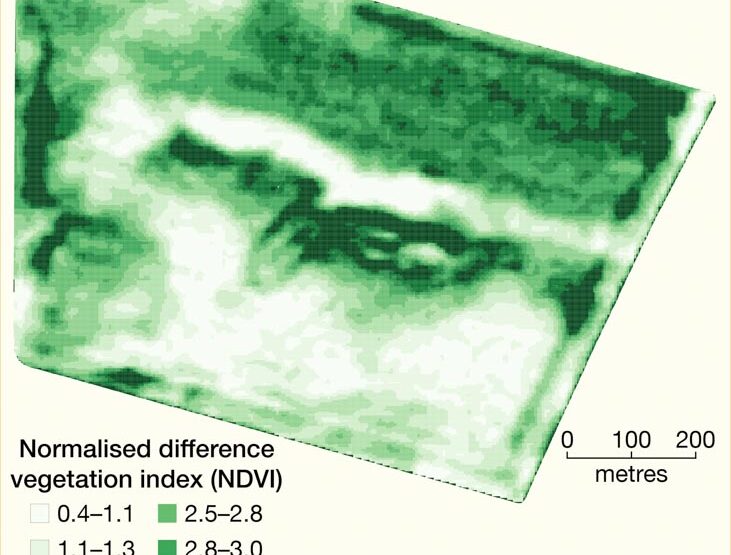
June biomass imagery was referenced to understand if there were any establishment issues and this showed high correlation to the 2020 barley yield data.
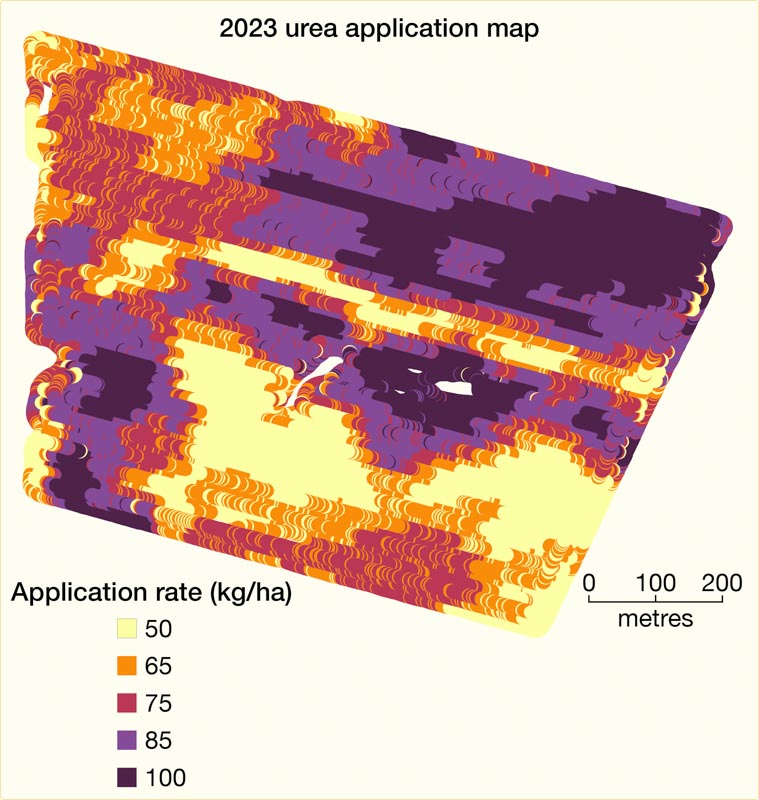
The multi-year yield map was used as the reference layer to create the 2023 top up urea prescription map. Urea rates were 50, 65, 75, 85 and 100 kilograms per hectare, resulting in an average rate of 75 kilograms per hectare of urea.
Even though there was a high correlation between 2023 June biomass map and the 2020 barley yield map, the multi-year yield map was used to create the prescription map, as seasonal conditions can change quite quickly and greatly influence production in this environment.
Creating a practical prescription map
An important consideration when creating a prescription map is how it will translate from the software creation to machinery application. Understanding that the width of machinery will determine how precise the rate changes can be.
Increasing and decreasing rates takes time and therefore sufficient area should be left to allow for the rate changes. The fertiliser application map below demonstrated how the prescription map translated to product application in the field. The focus of variable rate within this nitrogen strategy was to reduce wasted product in areas of poor water holding capacity and lower yield potential.
Reference
ebook Soil Quality: 10 Plant Nutrition
Scanlan C, Bell R, Weaver D, Borrett R and Cheng M (2023).

