When assessing whether investigation for potential soil constraints is warranted, it is important to keep in mind that soil characteristics can gradually change over time.
-
Observations during the growing season can indicate where soil constraints may be limiting production.
-
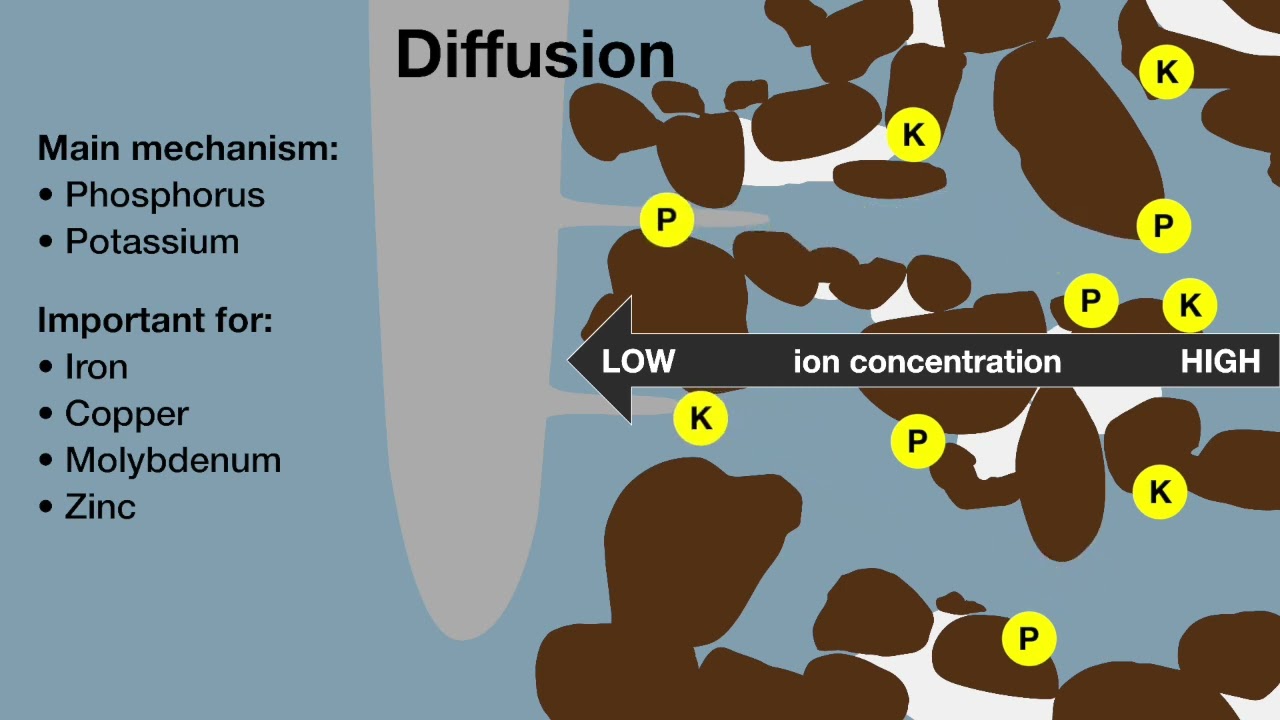
Simple equipment and basic testing can indicate water repellence, compaction, acidity, nutrient or biological constraints.
-
Sampling and analysis can be undertaken to confirm and quantify soil constraints.
-
Additional information from remote sensing or mapping sources assists with detection of soil constraints.
Initial observations
Soil constraints may not be obvious in any one season nor consistent from season to season. Yield maps are a valuable aid to check for differences and trends in actual versus potential yields and patterns that may suggest a soil constraint.
Talking to older generations or previous landholders can help to develop an understanding of past paddock performance. A change in the types of crops that do well can indicate soil constraints; do barley and canola now perform poorly relative to wheat whereas previously they didn’t?
If you have a paddock that you think is not performing as well as it should, keep an eye out for indicators of soil constraints during the growing season.
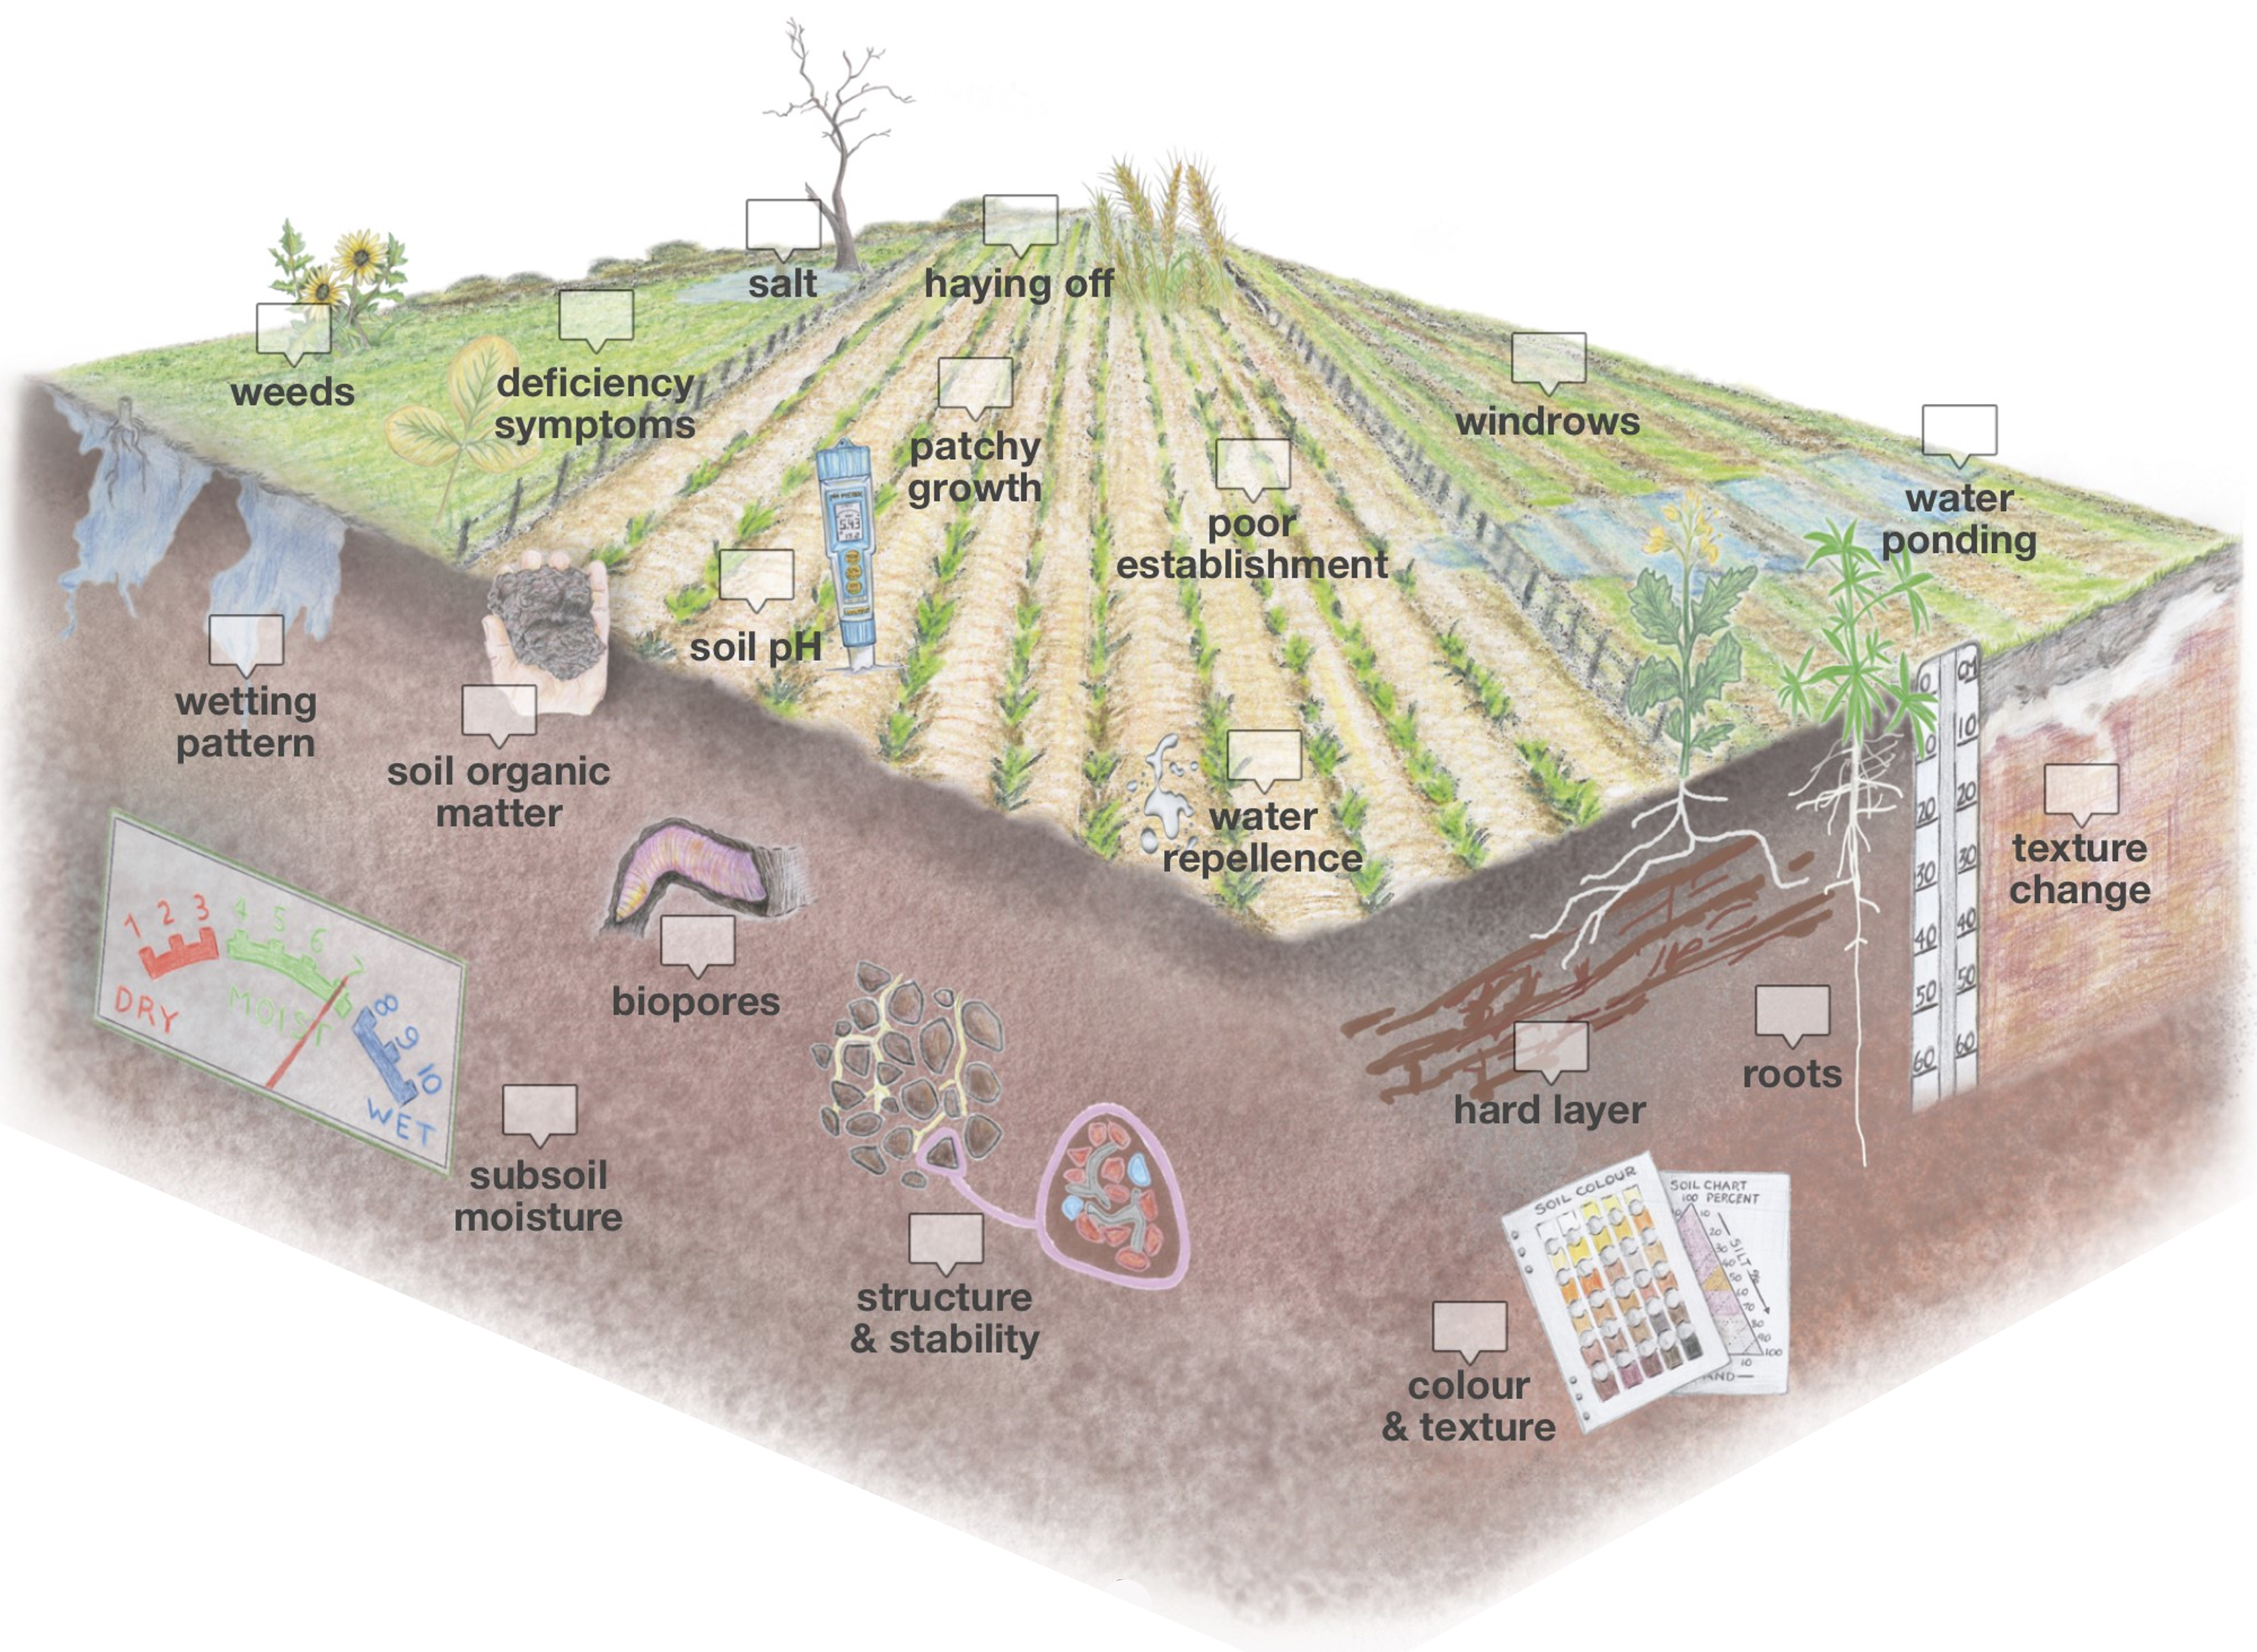
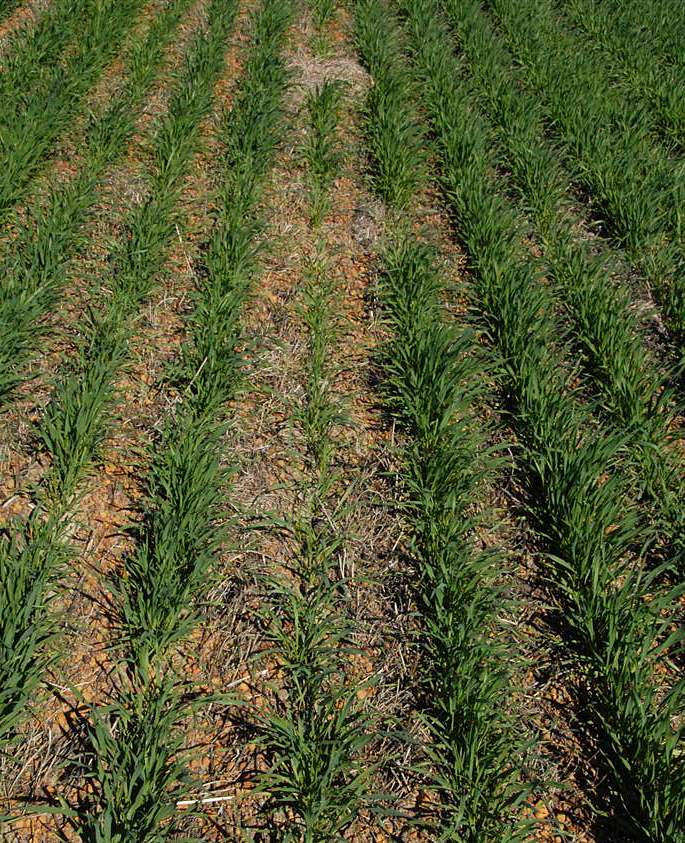
Patches of weeds that are hard to kill, particularly radish (Raphaneus raphanistrum) and to a lesser extent ryegrass (Lolium rigidum), are indicators of soil limitations to crop and pasture growth.

Leaf symptoms such as discolouration and interveinal chlorosis can indicate nutritional deficiencies. If nutritional deficiency is suspected, follow-up plant tissue testing can confirm the diagnosis and help decide whether fertiliser applications are warranted.
When tissue testing shows that plants have nutritional deficiencies even though soil tests show that nutrients should be available, other soil constraints may be inhibiting access to and uptake of nutrients from the soil; in this case, further investigation is needed.
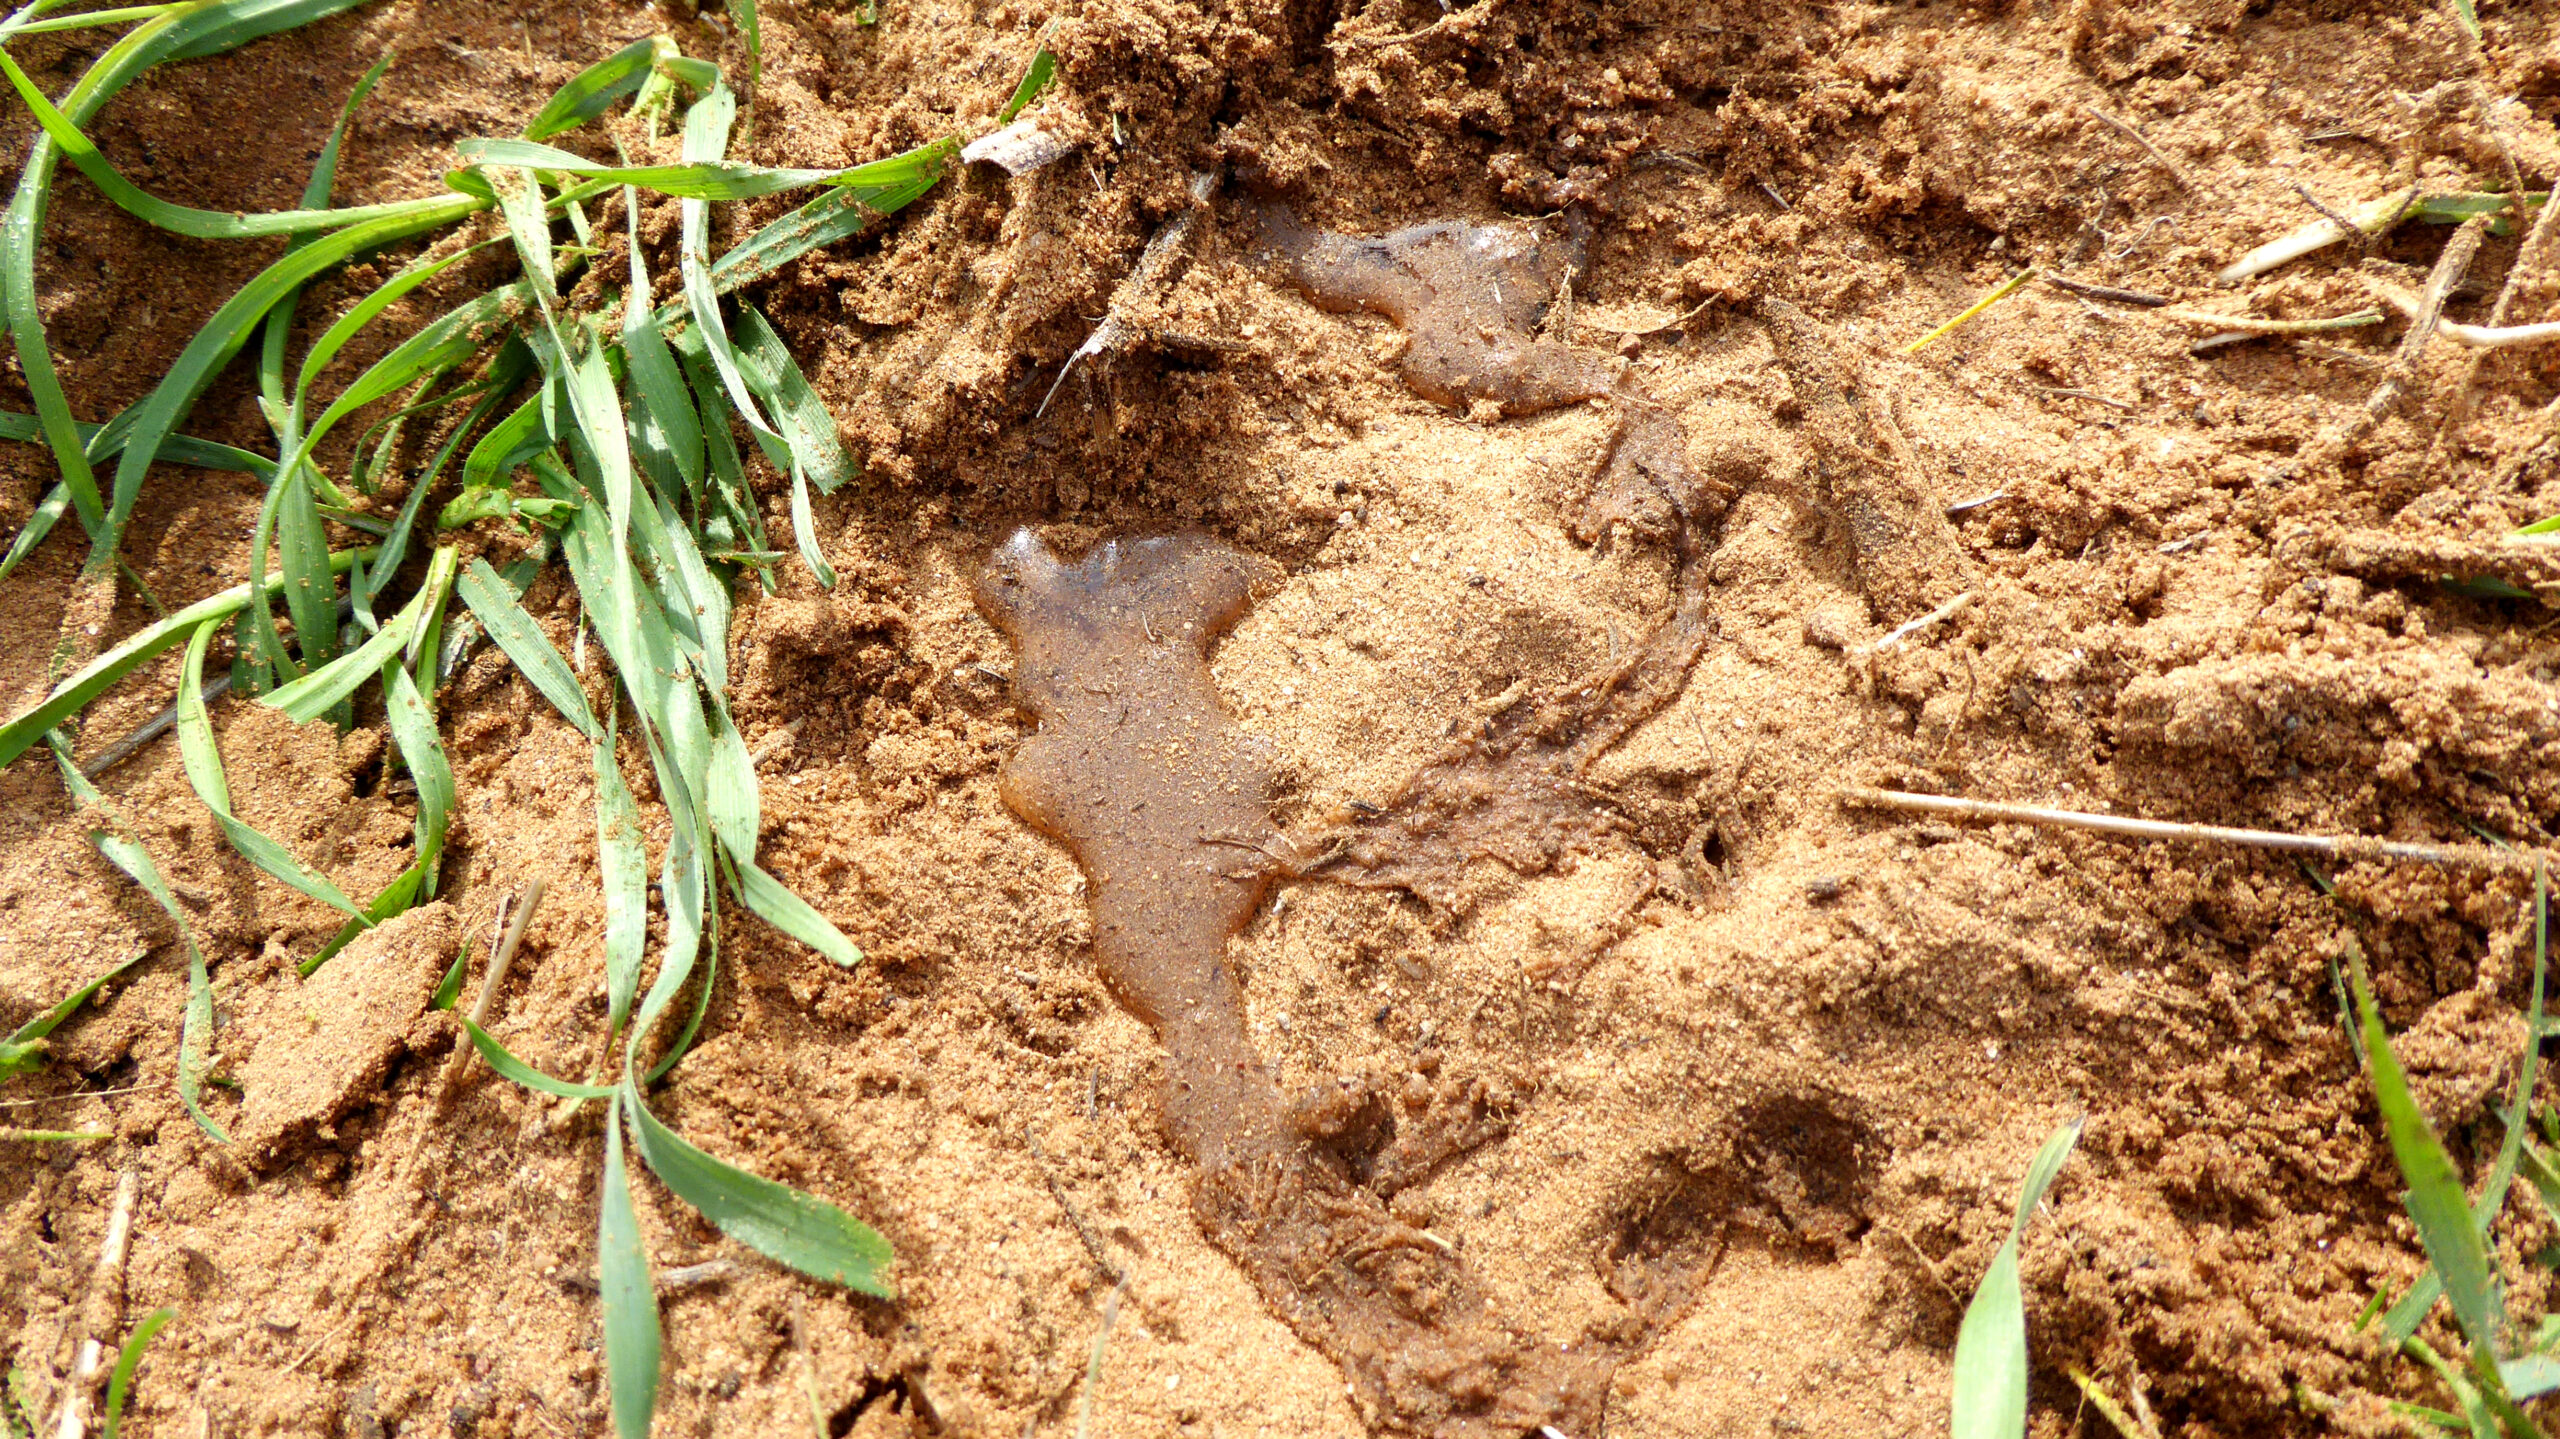
Seeps of saline groundwater can develop in lower areas of the landscape and, in severe cases, bare patches develop with salt visible on the soil surface. However, poor growth and yield loss as a result of saline soils can occur with no obvious indicators on the soil surface. Soil testing for electrical conductivity (EC) can confirm whether salinity is causing the symptoms.
Indicators of dryland salinity:
- white crust or crystallisation on dry soil surfaces
- unusually friable or ‘puffy’ soil structure in low-lying areas when dry damp patches in otherwise dry soil
- unusually clear water in puddles and drains
- patches of reduced growth or yield, marginal and tip burning of leaves, followed by yellowing and bronzing
- subsoil appears wet after harvest, even when the finish was dry
- increased numbers of salt tolerant weeds
- death of clovers and some trees
- bare scalded areas appear and progressively get bigger
Premature haying off (senescence) in dry seasons usually indicates poor root growth and inability to access subsoil water. Likely causes are an impermeable subsoil that could be compacted and/or soil acidity. Haying off can also occur on soils with low plant-available water holding capacity, for example pale deep sands, coupled with warm and dry finishes to the growing season.
To work out if restricted rooting depth is due to soil acidity or alkalinity, collect soil samples just below the rooting depth and send to a laboratory for analysis. In the field, you could use a soil pH test kit. To get a better picture of the pH profile, spray the universal pH indicator from the test kit over the face of the pit. You will see how deep the acidic or alkaline soil is and get some indication of the severity. It is important to clear off the pit face to remove any topsoil that may have fallen onto the subsurface soil.
Highly alkaline subsoils often have high levels of carbonates which can be easily determined by a ‘fizz’ test, and simply involves adding acid (vinegar or dilute hydrochloric acid) to the soil; if it fizzes, carbonates are present.

Highly alkaline subsoils are commonly also sodic and dispersive. Sodic soils feel slippery or soapy when rubbed between the fingers. A simple dispersion test can refine your diagnosis. Follow-up soil testing is advisable for sodic soils to show the degree of sodicity and help inform amelioration processes for sodicity and other soil constraints.
Patches in small areas (tens of square metres) of crop or pasture can indicate soilborne diseases like nematodes, rhizoctonia root rot and take-all.

Compaction from wheel tracks, and water repellence can occur in patches, often related to soil type.
Careful diagnosis is required to identify the cause of patchiness. Examination of plant roots will often provide the best indication of soilborne diseases. PREDICTA B soil testing can provide information on the severity and extent of soilborne diseases.
Water repellent soil is indicated by patchy, staggered crop, pasture and/or weed emergence coupled with significant areas of dry soil despite sufficient rain.
Poor establishment can also result from seeding problems or other constraints such as disease, hardsetting or surface crusting.
It is important to examine plant roots for evidence of disease. PREDICTA B soil testing is useful to identify diseases.
Testing for dispersion and slaking can indicate if soil is prone to hardsetting or surface crusting.
If your soil is less than 10%, clay, water repellence is possible. If the soil is dry, carefully scrape away a few millimetres of soil, being careful not to mix it, and pour on some water to check for water repellence.
To get an idea of the severity of repellence, you could perform a simple water droplet test.
Differences in growth on and off crop windrows can indicate constraints such as nutritional deficiencies or soil acidity and provide an opportunity for diagnosis by carrying out soil and plant tissue tests on and off the windrows.

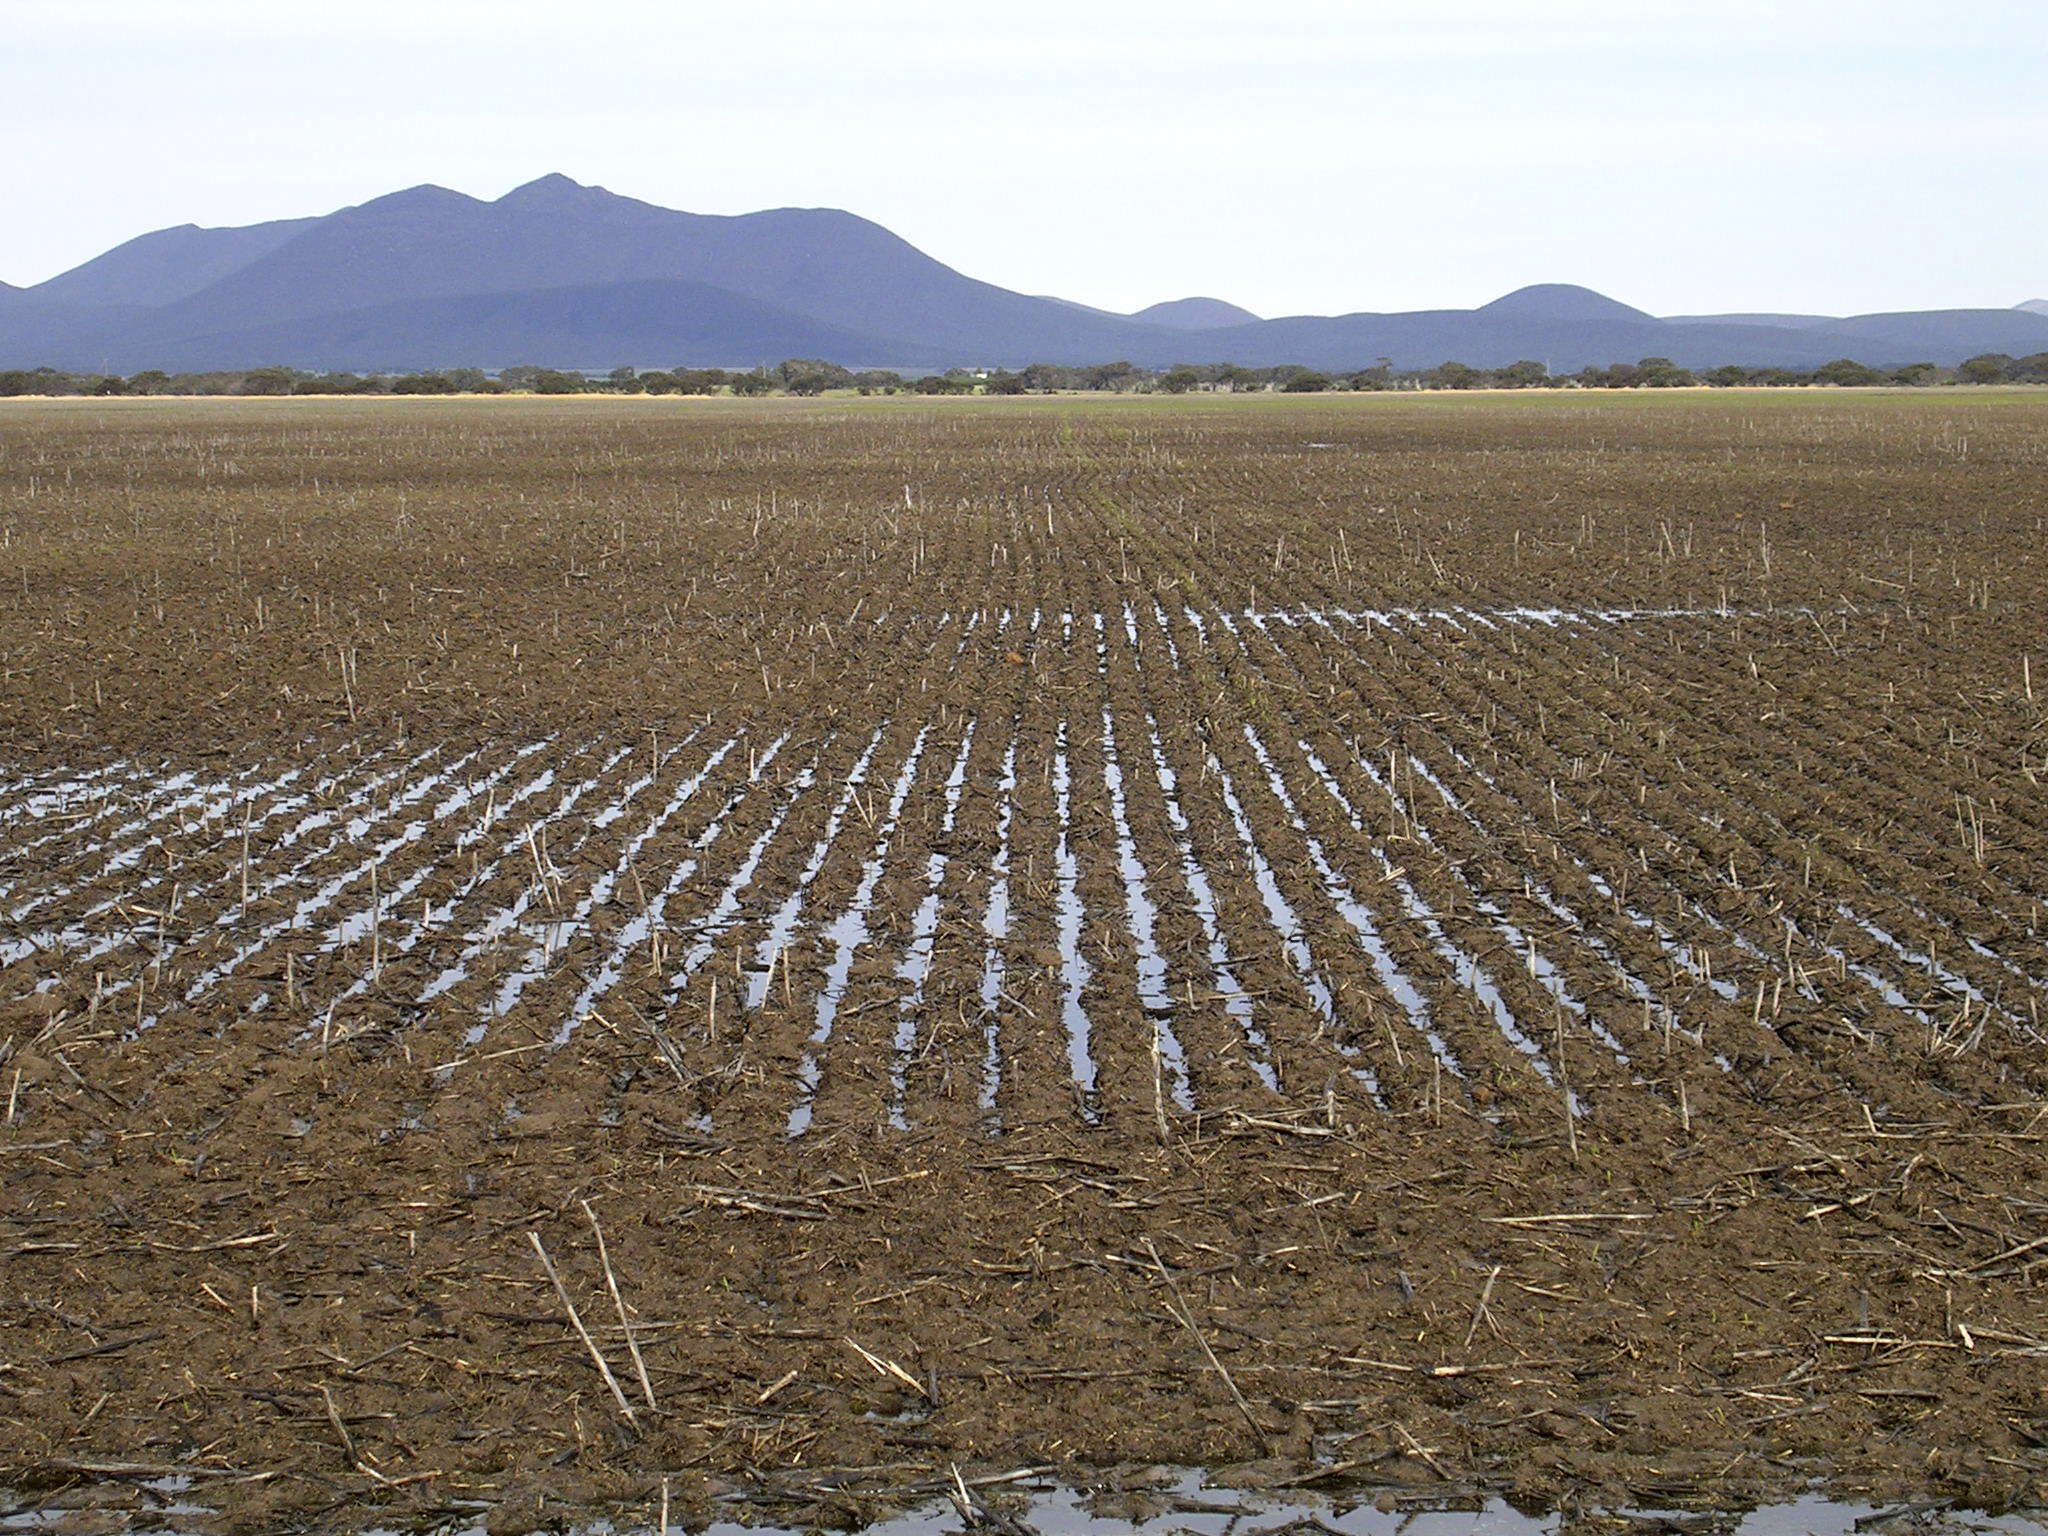
On light soils, rapid ponding of water on the soil surface during reasonable rainfall and dry soil below the ponded water during or shortly after rain indicate water repellent soil. Observing how long the ponding lasts is important. Temporary ponding, typically on a small-scale, indicates water repellence.
Water perched on the top of shallow clay B-Horizons in duplex soils can exhibit as water ponding. In this case, the ponding is a result of the texture change in the soil.
Surface crusting, water runoff and surface water ponding can occur on heavier soils if soil stability is compromised because of chemical factors (usually sodicity) or management factors (such as low retention of stubble and compaction). Sodicity can result in poor germination and poor water drainage.
A texture change may indicate a limited depth of soil rather than a constraint that can be overcome.

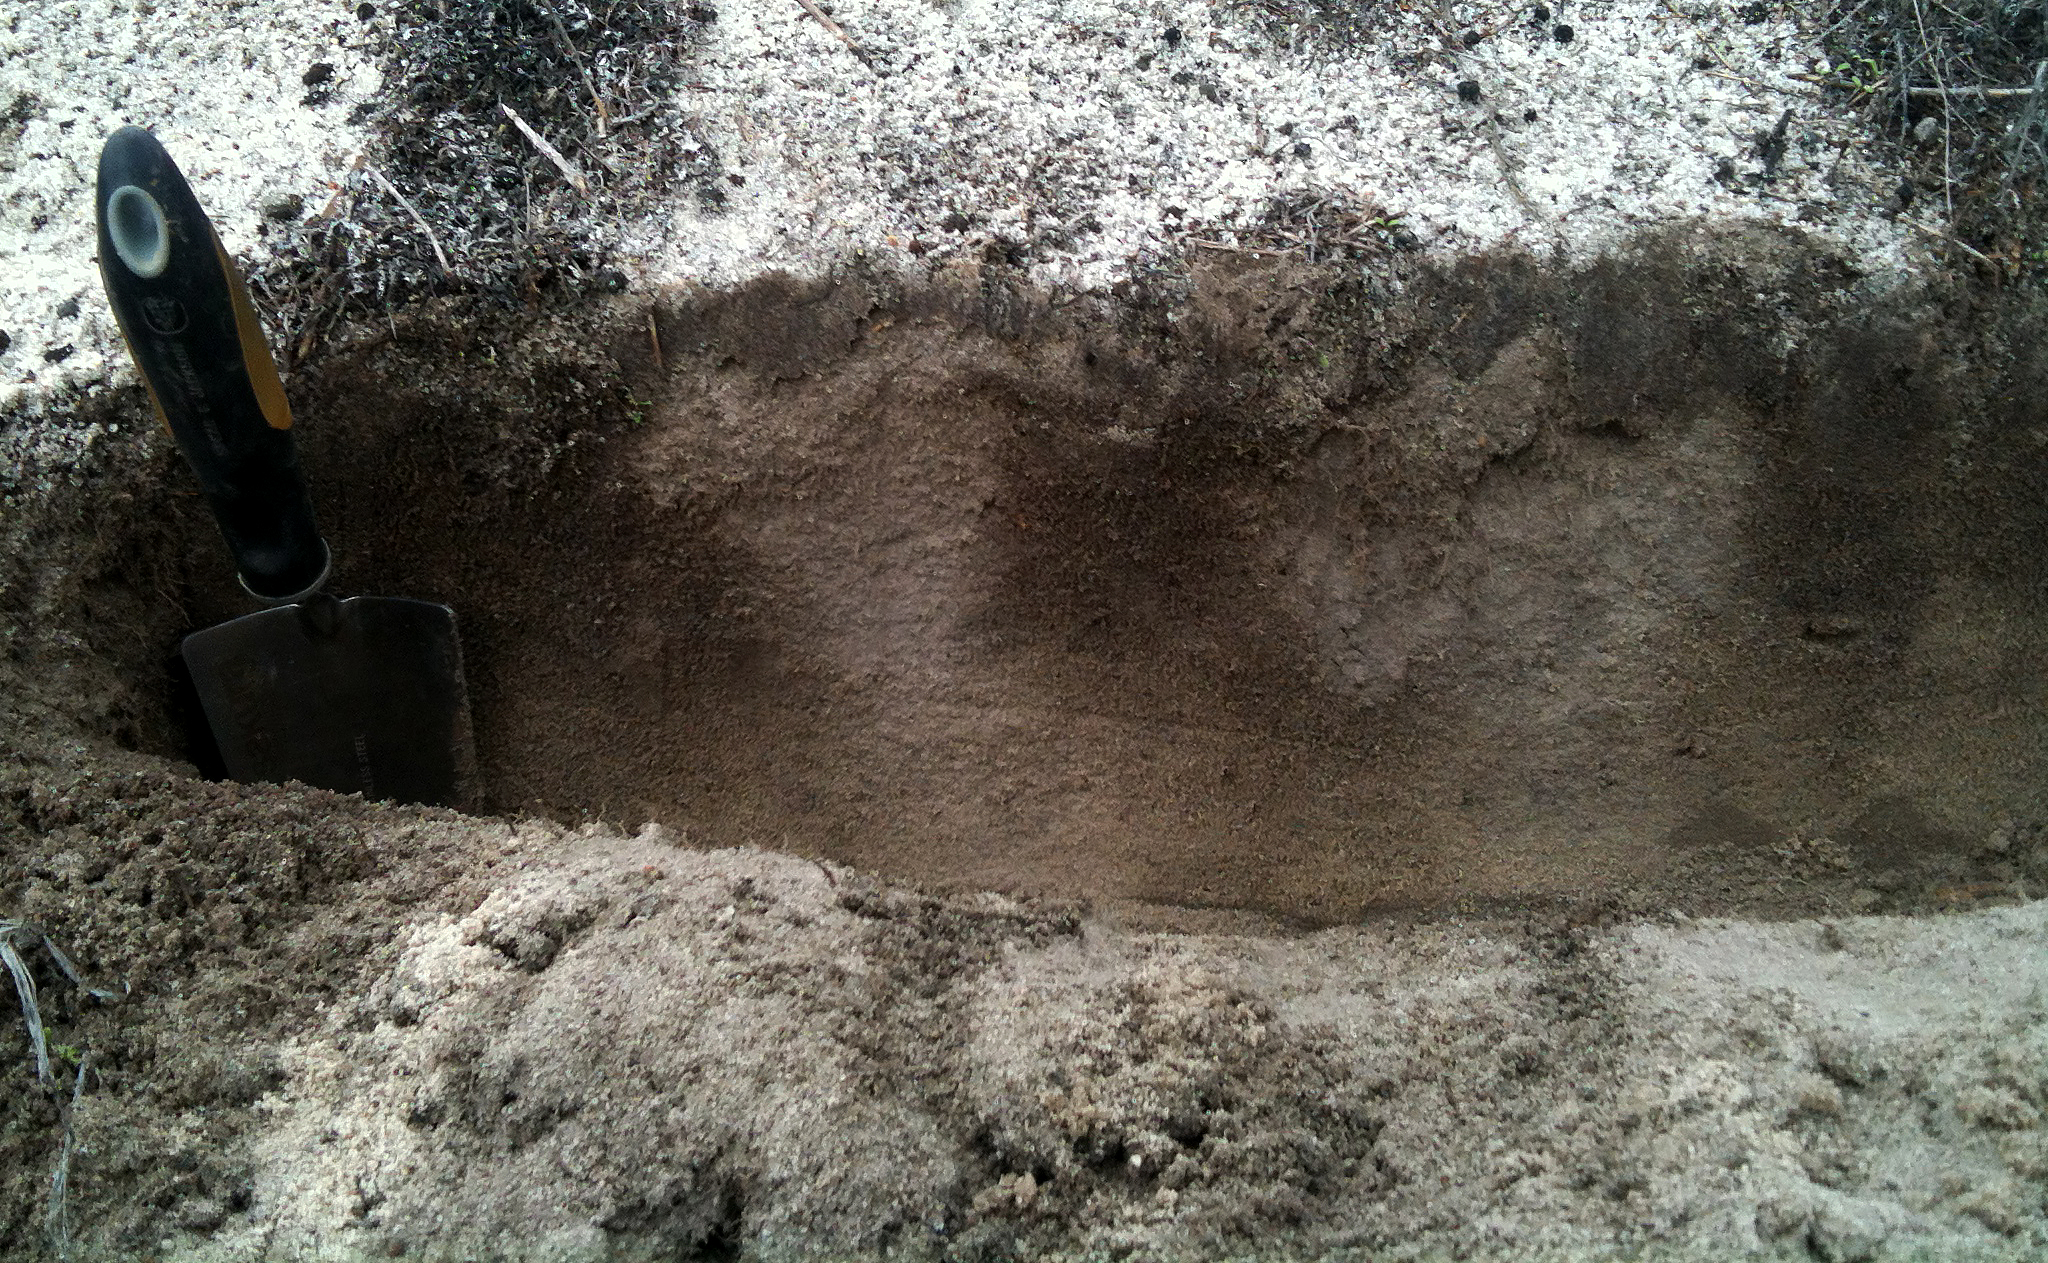
Plant root growth can be examined around 8-10 weeks after sowing or later for many broadacre crop species. Check that roots are healthy—white and fibrous—and ‘charging’ downwards. To find roots, loosen soil off the pit face with a knife blade or small trowel. If this is done towards the end of the growing season, roots may be present deep in the soil profile, but the time it took to reach that depth (rate of growth) may have been a limitation to plant growth during the year.
Restricted rooting depth can indicate compaction, soil acidity, poor soil stability and/or high clay content. It can result in limited access to leached water and associated nutrients.
At 8-10 weeks after sowing, roots in most sandy and loamy soils should be found growing beyond 30-40 cm.
If roots are mostly confined to the top 15-20 cm of soil, a physical or chemical constraint is likely to be restricting root growth. In high clay content soils and shallow duplex soils, root growth can be slowed by the heavy textured soil.
Compaction and soil acidity can cause horizontal root growth, increased branching and greater root density above the constraint. These are often termed ‘umbrella roots’ because the shape resembles an umbrella when pulled up, especially in canola. Root tips in contact with acidic or compacted soil may appear swollen/deformed. Roots growing through a fracture in a compacted layer often form a flat mat of roots within the fracture.
Roots of seedlings affected by rhizoctonia root rot have brown discolouration and ‘spear’ tips as a result of rotting off. Roots of plants infected with take-all can have blackening of the centre of the roots in early infection and additionally the crown and stem base with severe infection. Nematode infection also causes root discolouration and deformation. PREDICTA B soil analysis is an accurate way of identifying soilborne diseases.
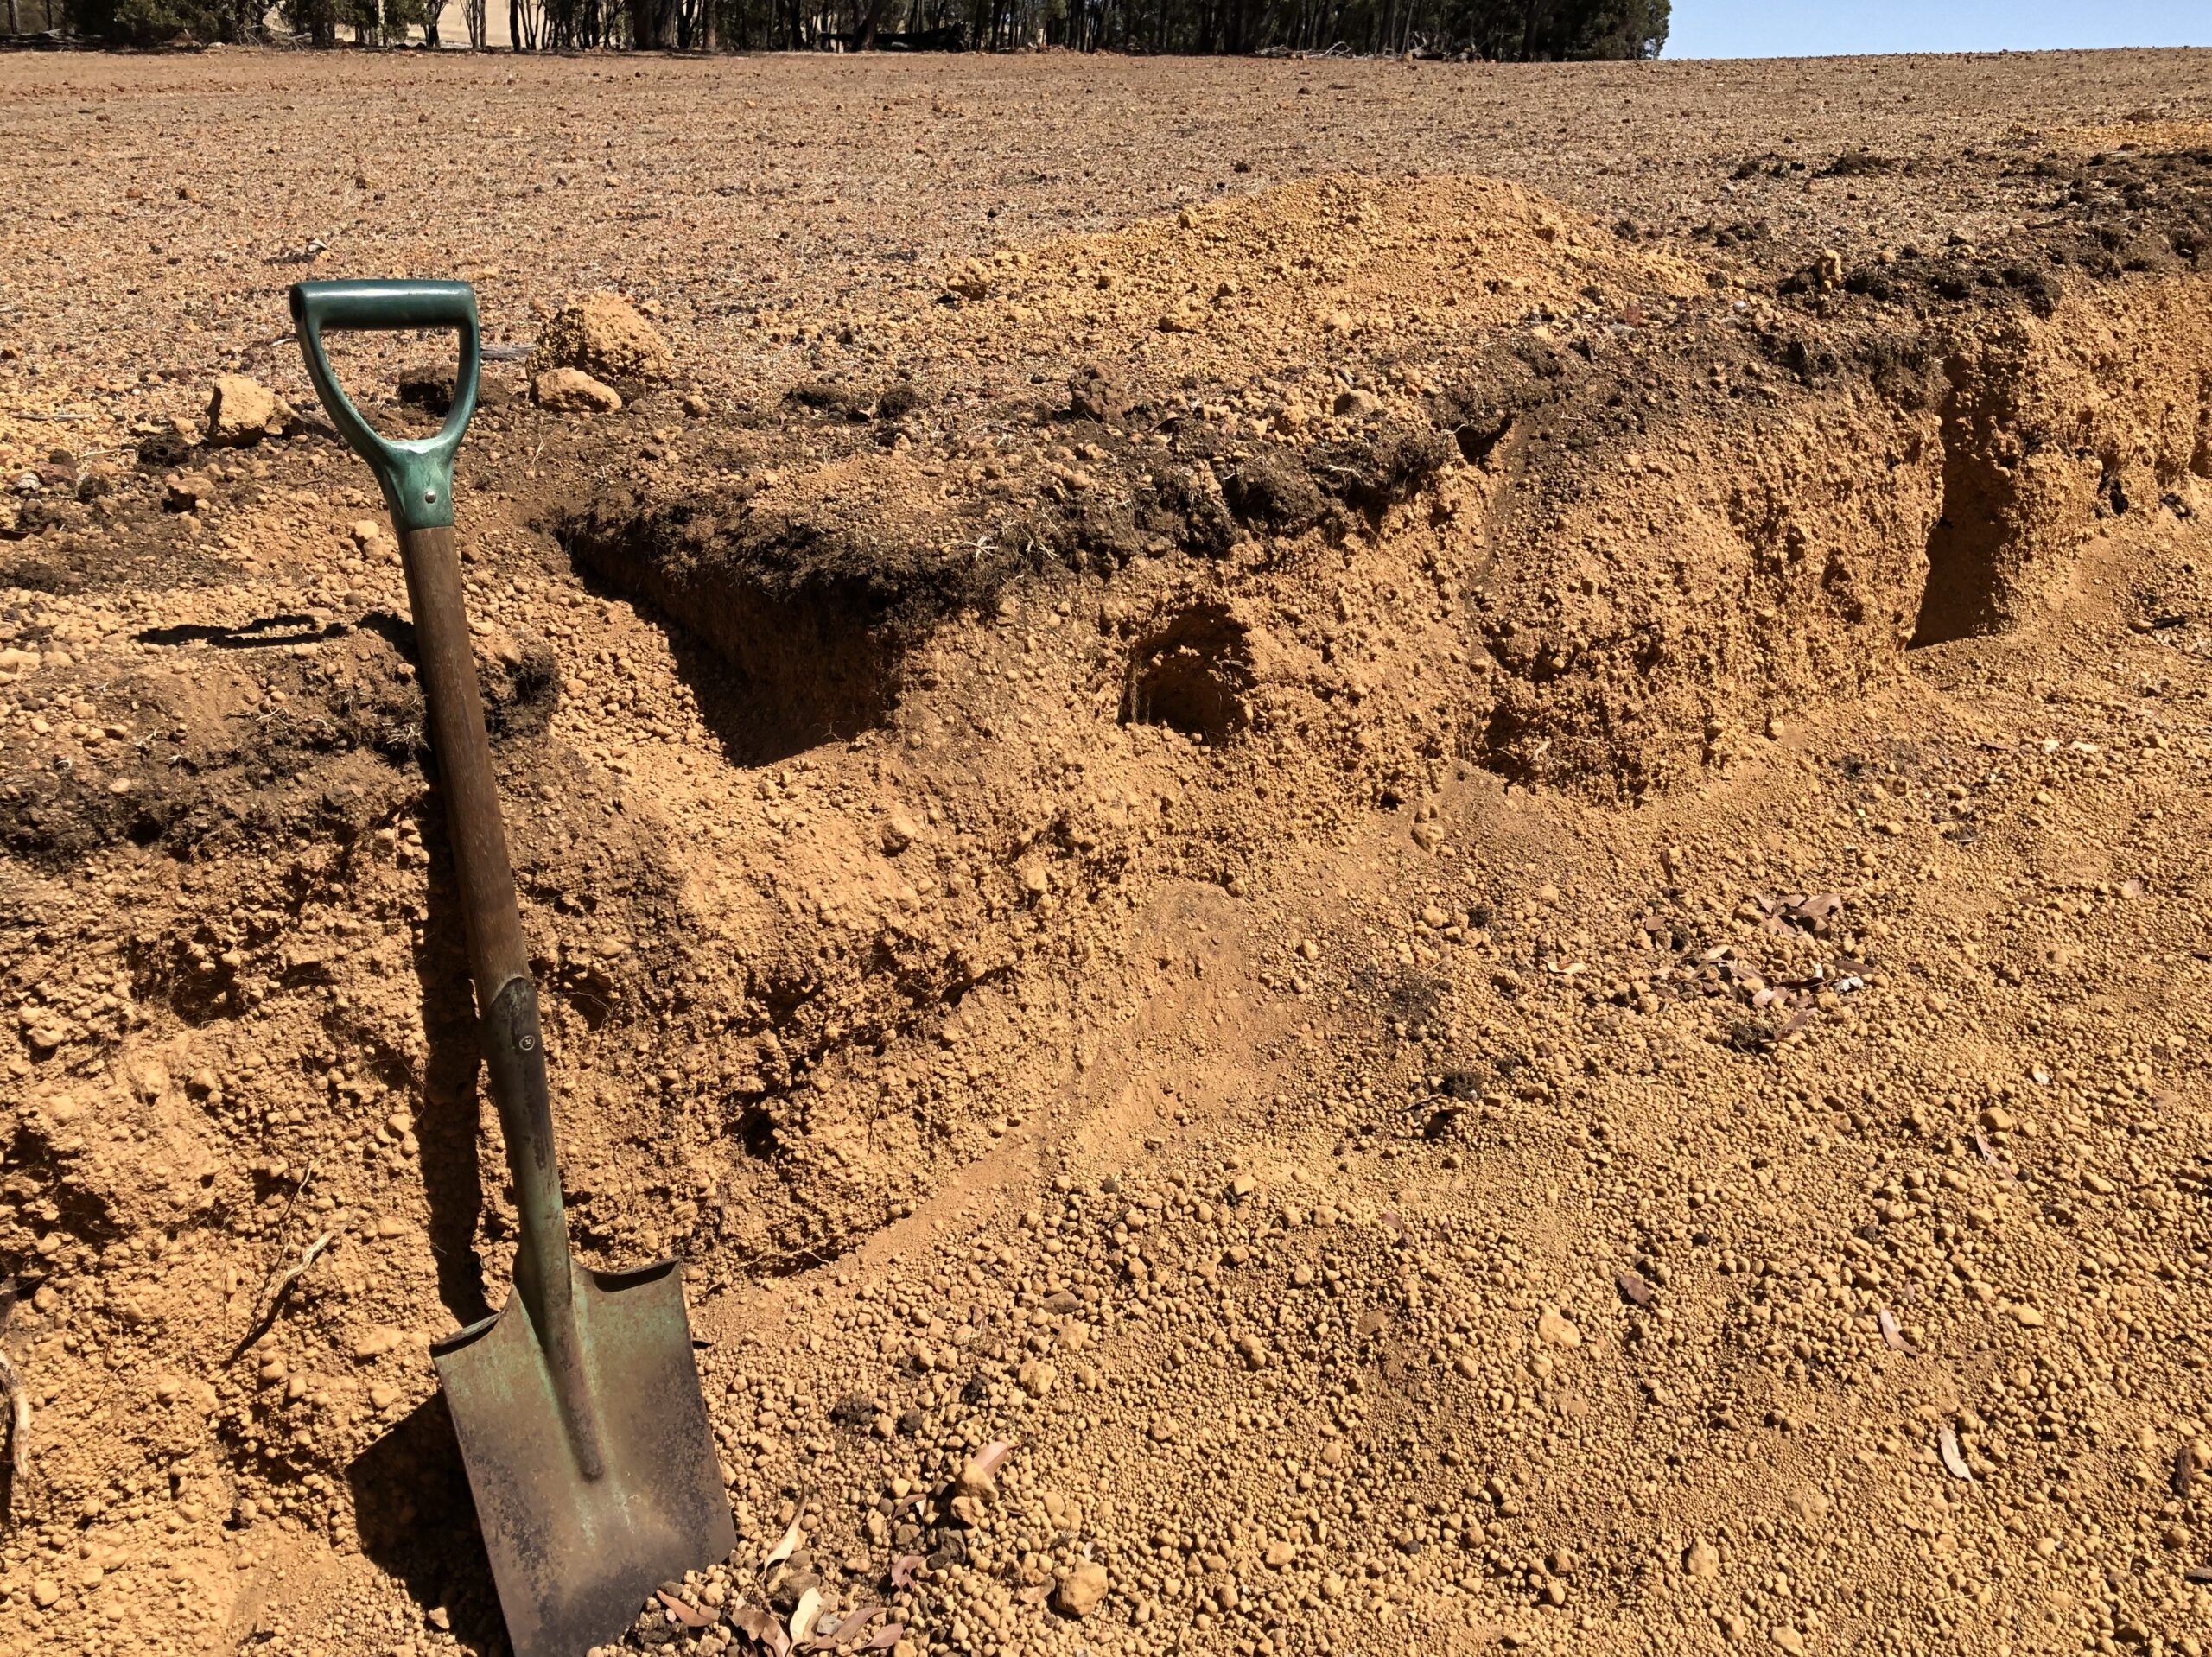
As you are digging an inspection pit, take note if you feel a hard or ‘compacted’ layer. Dig down as far as you can. The soil from the compacted layer will feel denser and harder than the soil above and below. The dense soil structure of a compacted soil layer may look different to the soil above and below and often has distinct upper and lower boundaries. Clods from a compacted layer will crack where pressure is applied rather than on a natural break line.

Often in sandy soils a compacted layer can form between 10 and 40 cm depth. With the increase in size and weight of farm machinery, compaction deeper in the profile (50 cm or more) is becoming more common.
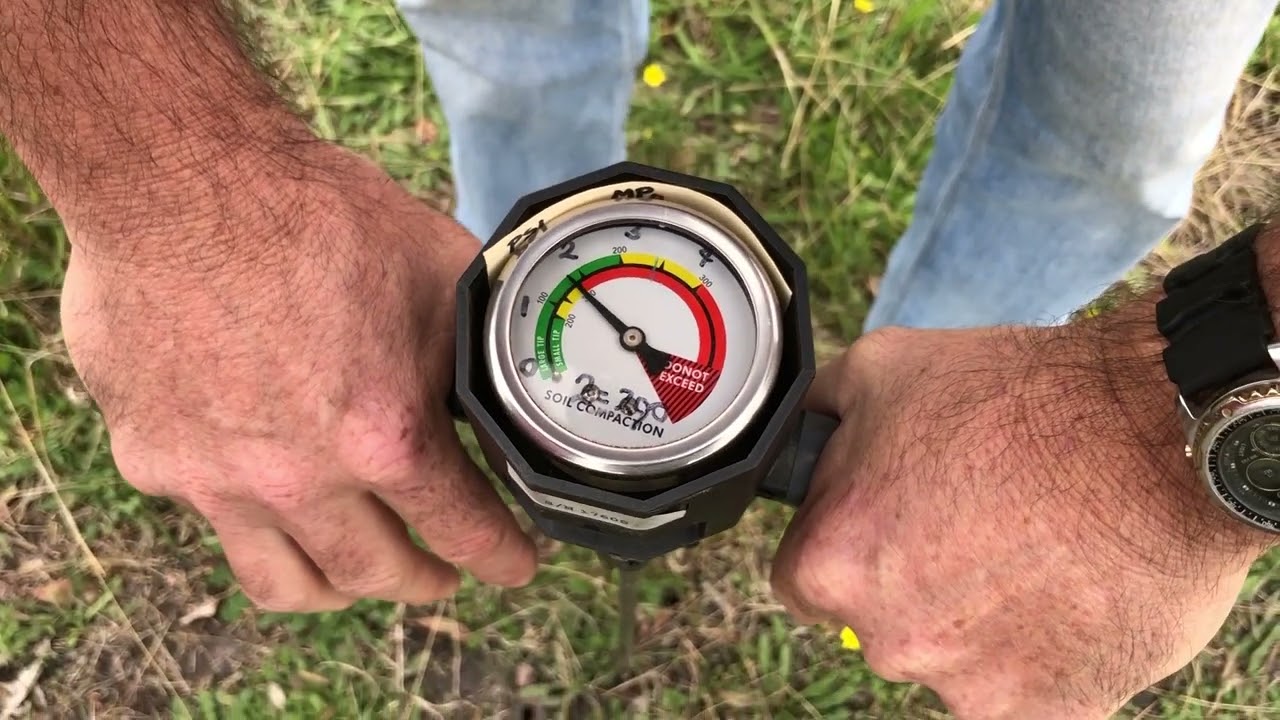
If the soil is wet, a hand probe is useful to detect the presence of a hard layer. Alternately if you have a penetrometer, you can get an indication of the severity of the compaction. Root growth starts to be restricted when the penetration resistance exceeds 1.5 MPa and is severely restricted at 2.5 MPa. In most cases, penetration resistance exceeding 1.5 MPa would be the trigger to consider appropriate management solutions depending on the depth and thickness of the hard-pan.
Take note of the depth and thickness of the hard-pan as this will determine what machinery is required to remove it.
If you don’t have access to a penetrometer or where a hand probe cannot be used, you can assess the impact of compaction by examining root growth in an excavated pit or soil face.
Soil colour and texture give an indication of the likelihood of nutrient limitations. Deep white sand is inherently low in nutrients while strongly coloured sands have more clay and generally have better nutrition. Soils with more loam and clay are likely to hold more nutrients than sandy soils.
Poor soil structure with few aggregates and poor porosity can indicate compaction, especially if in a layer of the soil.
Poor structure is often associated with soils high in clay that have a dense or massive structure and are prone to waterlogging.
In highly sodic soils, the physical stability of the soil is impaired, causing the soil to disperse when wet and the loss of soil aggregates and pores.
Slaking is associated with low soil organic matter and commonly occurs after heavy rain on dry soil leading to crusting, particularly in soils with a high proportion of silt or very fine sand.
A simple test can show if soil instability is caused by slaking or dispersion. Place a small amount of soil in a dish of water and observe the changes over time.
The presence of subsoil moisture at the end of the season usually indicates that root growth has been restricted by a constraint, most likely soil acidity or compaction.
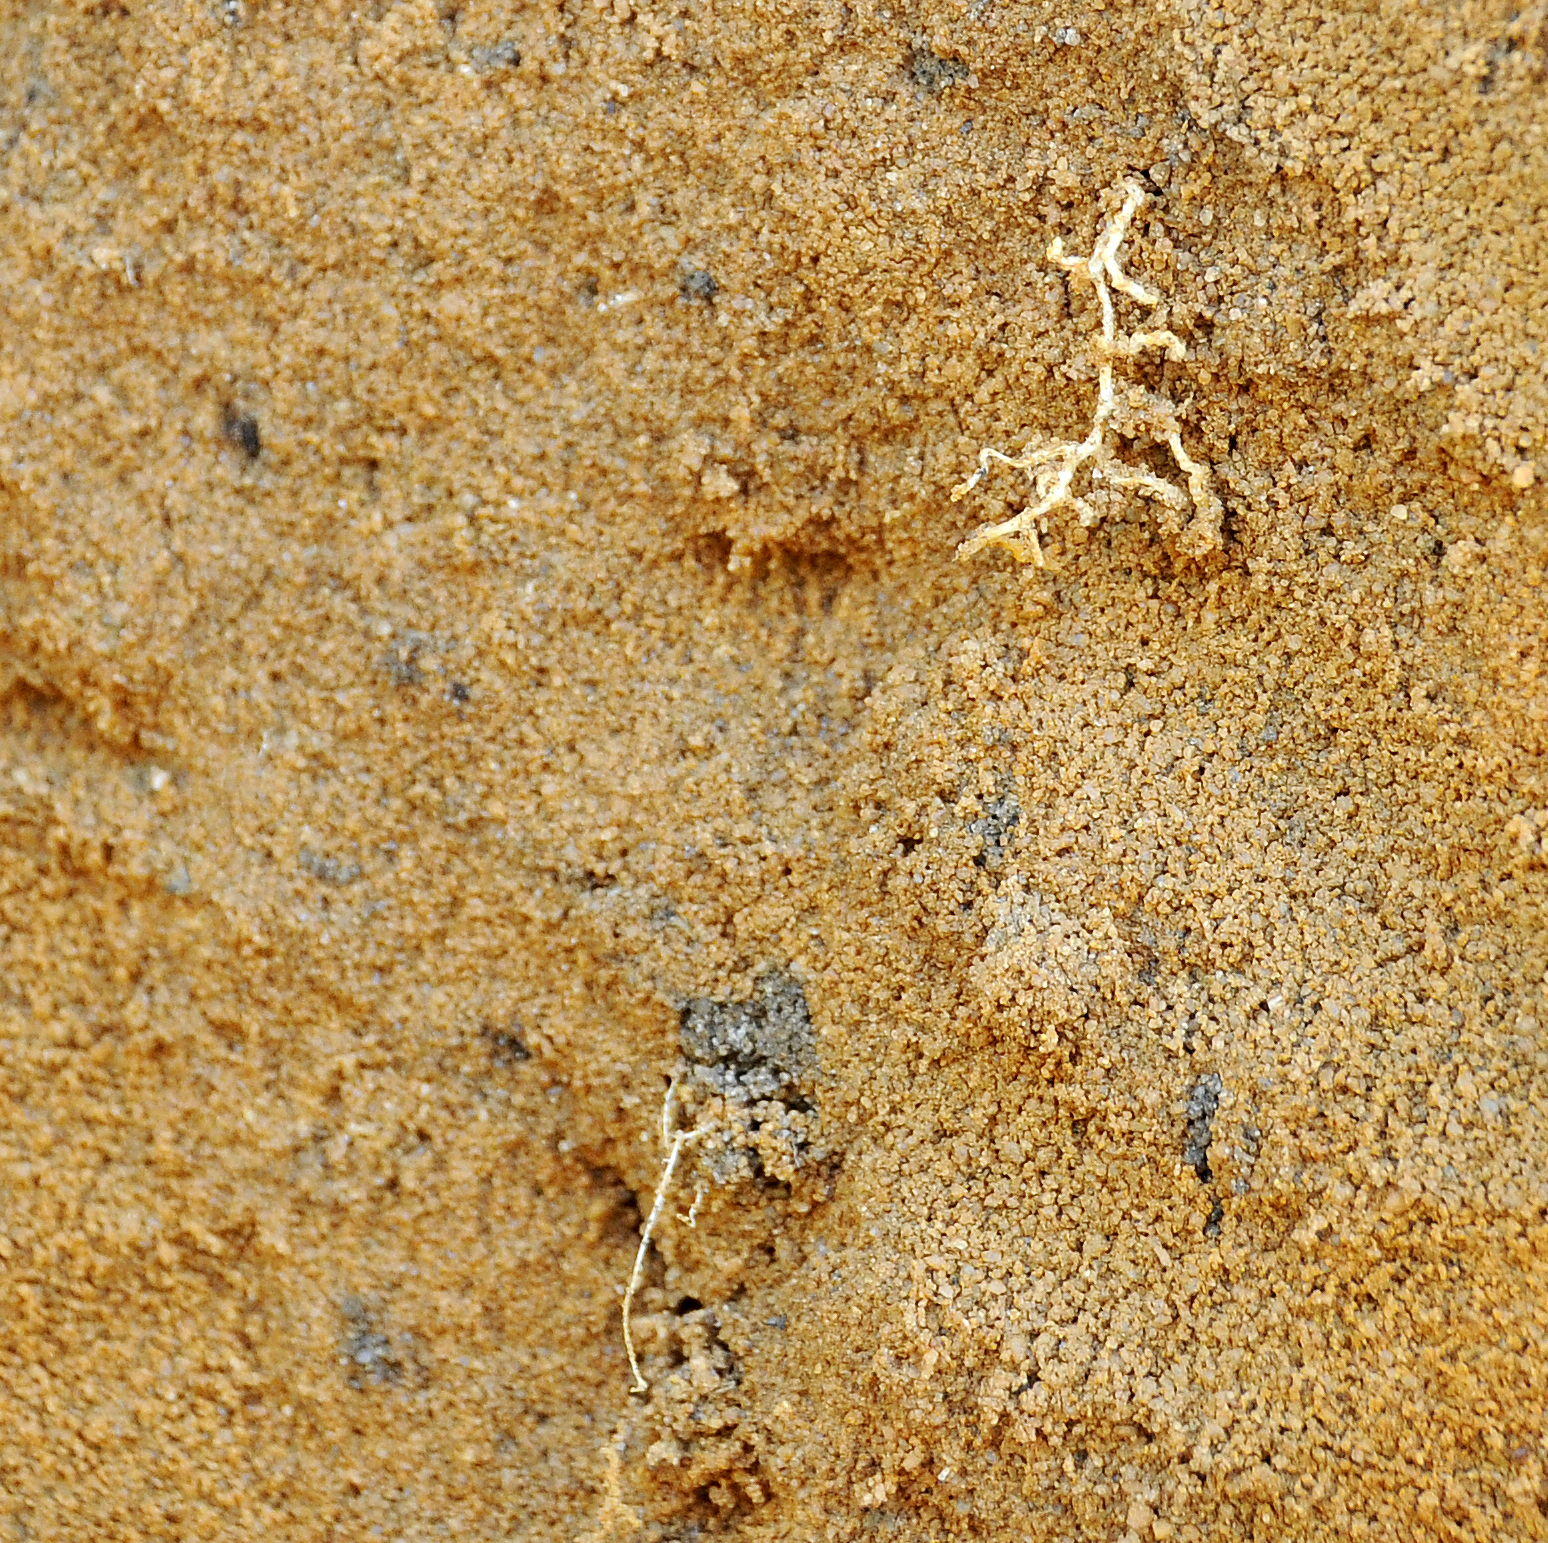
Look for roots following old root channels left by last year’s crop or even old native vegetation or worm and termite tunnels. If most of your deeper roots are only growing to depth via biopores, you are likely to have a soil constraint such as compaction or soil acidity.
The presence of effective biopores will influence the choice of method for alleviating compaction or soil acidity. More aggressive methods such as ploughing or spading can destroy the biopores and with them that pathway to greater rooting depth.
Soil organic matter includes living (active roots, living organisms) and non-living (root exudates, decomposing plant and animal material, humus and charcoal) inputs to soil. The darker colour of topsoil is related to soil organic matter content. In most soils, organic matter is concentrated in the topsoil and declines rapidly with depth. Nutrient supply and water holding capacity associated with organic matter may be poor at depth.
Good ground cover and good quality residues are above-ground indicators of high levels of soil organic matter. As you dig, look for roots and soil organisms such as worms and termites. Soil organisms will be most active in damp soil and are more numerous in soil with higher organic matter. Soils with good organic matter levels often have an earthy smell after rain and at high levels can be more ‘spongy’.
If you dig a pit after reasonable rainfall (10—15 mm or more), inconsistent wetting of the soil profile is likely to be caused by water repellent soil.
To confirm this, blue or red coloured food dyes mixed with water can be used to help to show the movement, or lack of movement, of water. The dye needs to be applied to dry soil with a watering can and left to infiltrate for 24 hours or more before small soil pits are dug to examine the infiltration patterns.

Rainfall may find preferred pathways and infiltrate the soil which can then wet-up from below, particularly in shallow sandy duplex soils.
The degree to which patchy crop germination and delayed emergence impact crop management, for example weed control, will determine whether amelioration is required.
Soil type and constraints
Chemical and physical soil constraints are often associated with particular soil types. Often, multiple constraints co-exist in the topsoil and subsoil. Identifying each of the limiting factors will determine the appropriate management options.
Disease issues are not necessarily linked to particular soil types, however diseases can be more of a problem in certain soils where environmental conditions are more conducive to expression of the disease, for example:
- Rhizoctonia solani (AG8) damage is more likely in low fertile sandy soils.
- Crown rot is more likely where the plant available water content is low in spring.
- Take-all has little effect at or below pH 4.7 (measured in calcium chloride), however the fungus can persist and may become a problem if the paddock is limed.
Common soil constraints associated with the main agricultural soils in the south-west agricultural region
| Major agricultural soils | Major topsoil constraints | Major subsoil constraints |
|---|---|---|
| Deep sands and sandy earths | ||
| Calcareous sands | Low water and nutrient storage; Water repellence | Low water and nutrient storage; Alkalinity; Compaction |
| Pale yellow and grey sands | Low water and nutrient storage; Acidity; Water repellence | Low water and nutrient storage; Compaction; Acidity |
| Yellow and brown sands and sandy earths | Acidity; Water repellence | Compaction; Acidity |
| Loamy earth soils | ||
| Calcareous loamy earths | Low nutrient availability | Compaction; Salinity; Alkalinity |
| Red shallow loams and red-brown hardpan soils | Crusting, hardsetting (structural decline) | Compaction; Poor subsoil structure; Shallow soil depth; Boron toxicity; Cemented hardpans; Salinity |
| Texture contrast (duplex) soils | ||
| Sandy and loamy duplexes with alkaline subsoils | Low water and nutrient storage; Acidity; Water repellence | Alkalinity; Sodicity; Salinity; Poor subsoil structure; Shallow rooting depth; Waterlogging; Boron toxicity |
| Sandy and loamy duplexes with non-alkaline subsoils | Low water and nutrient storage; Acidity; Water repellence | Acidity; Shallow rooting depth |
| Gravelly soils | ||
| Sandy gravels | Low water and nutrient storage, Acidity, Water repellence | Low water and nutrient storage |
| Loamy and shallow gravels | Acidity | Low water and nutrient storage; Cemented gravels; Shallow soil depth |
From Soil Quality: 1 Constraints to Plant Production (Murphy et al. 2017).
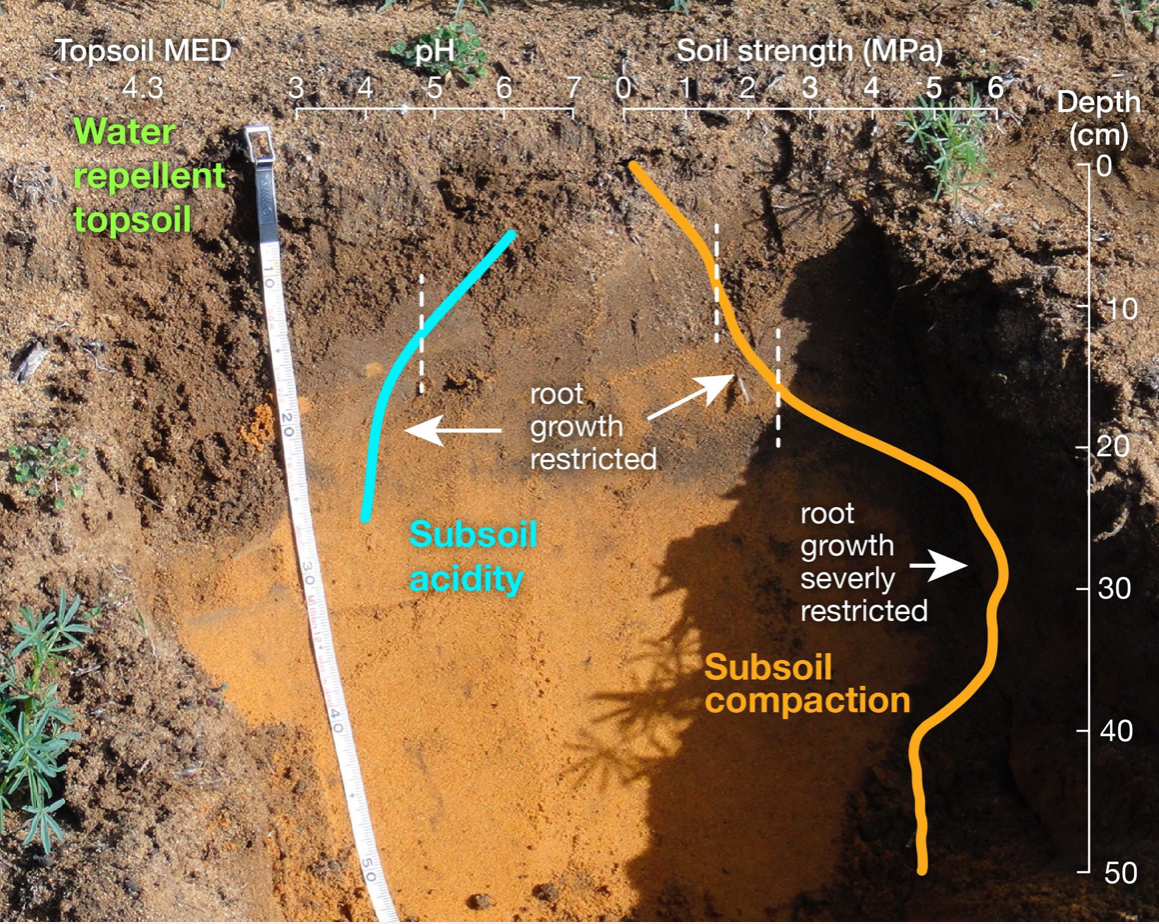
As an example, the image below shows measurements of multiple constraints in a typical deep yellow sand. The potential strategies to overcome the constraints in this soil type, and other key soil types in WA, are expanded here.
Digging deeper
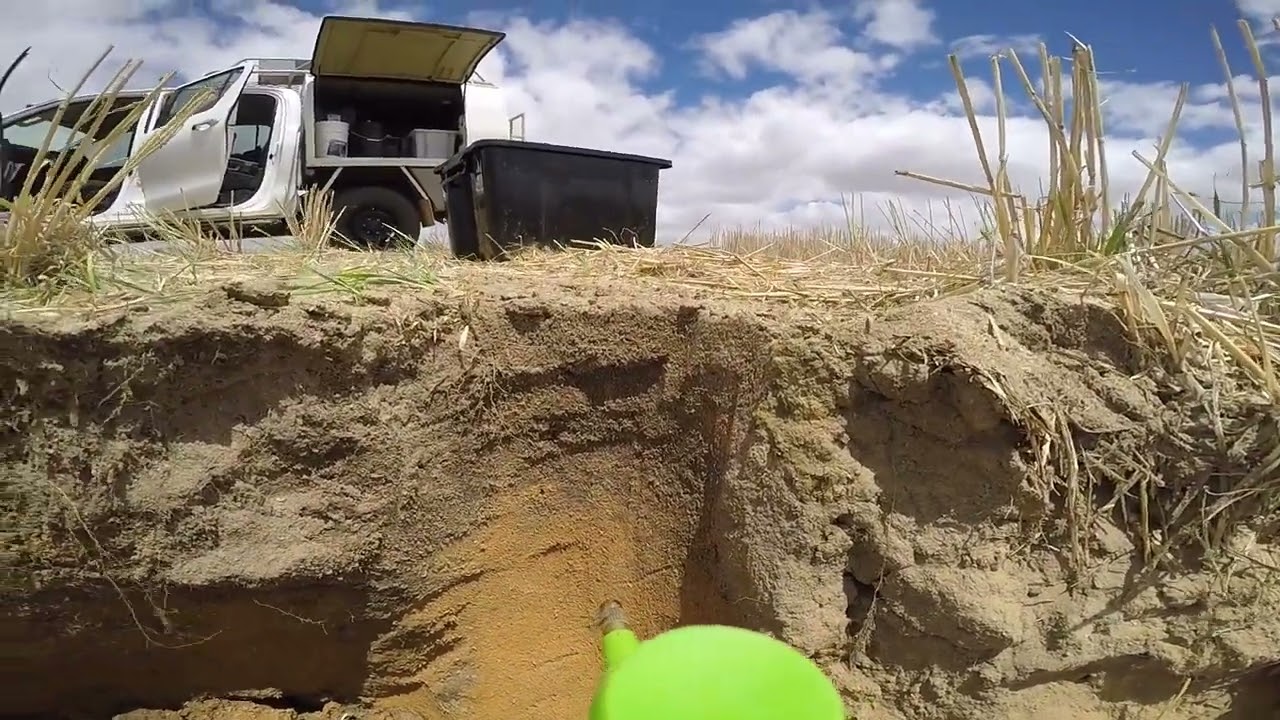
If you suspect soil quality is constraining production, it is worth using a shovel to look at the soil. Digging holes and spending some time at a few places in the paddock will give you a good idea of what constraints are present and if it is necessary to proceed to digging deeper soil pits and more intensive soil sampling.
Many farmers find it worthwhile to have their agronomic consultant with them when inspecting soil so both have a good understanding of the soil condition.
Paddock records will provide useful clues. If you don’t use controlled traffic and it has been a few years since you deep-ripped, compaction could be constraining root growth, so check for hard layers. If liming hasn’t been a regular part of your farming practice, check for acidity in topsoil and subsurface soil, especially if sensitive crops such as barley and canola have been yielding poorly.
Ute kit for identifying constraints

-
Post hole shovel
-
Home-made soil probe to test soil for compaction (when soil is moist)
-
Note book and pencil
-
Buckets/sample bags for collecting samples if you need to test further
-
Trowel for taking soil samples
-
Permanent marker
-
Water to check for water repellence and slaking/dispersion of heavier soils
-
Jars/plastic containers for dispersion test
-
Vinegar to test for carbonates
-
Knife for teasing out roots
-
pH test kit
-
Phone/camera

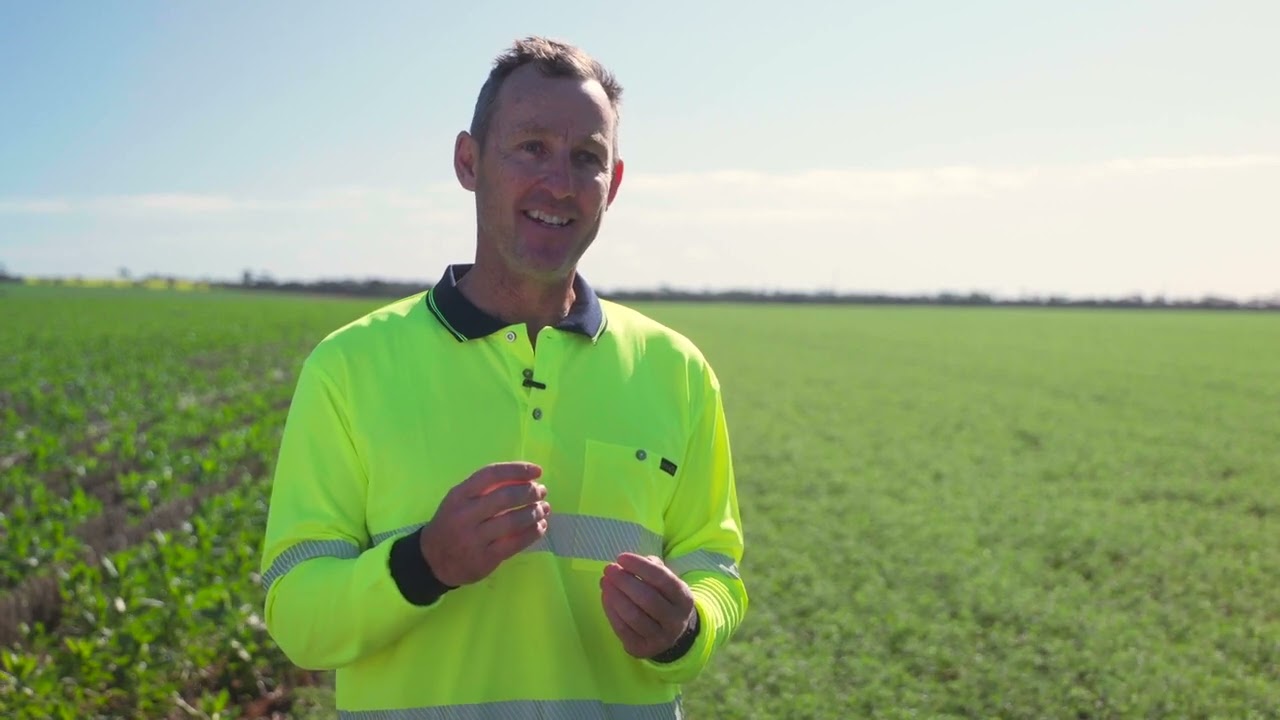
Diagnosing constraints on your farm.
Most of what you need is already in your shed or on the back of your ute. From Soil Quality: 2 Integrated Soil Management (Pluske et al. 2018). Video talent: Andrew Wherrett, Living Farm; video production: Lomax Media.
Information on soil constraints and their measurements are found on dedicated pages. Here are some direct links to methods for do-it-yourself testing for soil constraints.
- Universal indicator for measuring soil pH.
- Penetrometer for measuring compaction. A range of penetrometers and their use are demonstrated in this video.
- Simple droplet test for measuring soil water repellence.
- Aggregate stability test for measuring slaking and dispersion.
The video below demonstrates one method to take soil samples using an exhaust tube.
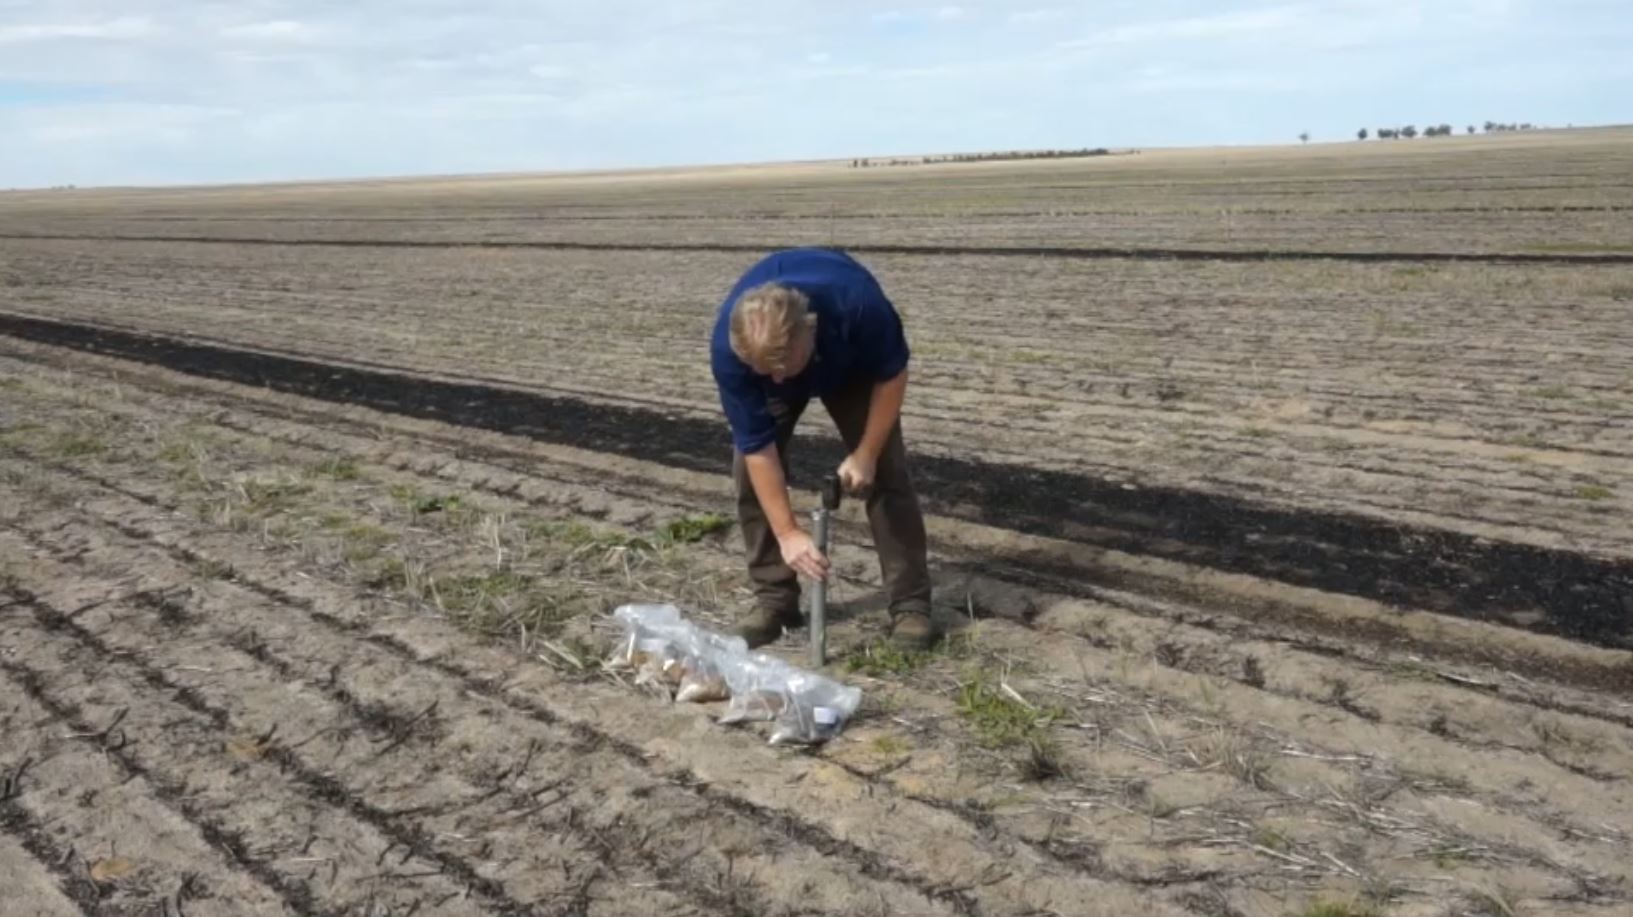
Do-it-yourself soil sampling with exhaust tube.
From Soil Quality: 2 Integrated Soil Management (Pluske et al. 2018). Video talent: Chris Gazey, DPIRD; editing: Science with Style.
Sampling and analysis
It is important to know the severity and extent of constraints in order to make informed management decisions. For soilborne diseases, soil acidity and nutrition, this is best achieved by adequate soil sampling and laboratory testing. For other limitations like water repellence, subsurface compaction and sodicity, visual observations and simple tests as well as laboratory testing can be used.
Ideally, if you have a good idea of the range of constraints that may be present in your paddock from soil examinations, you can include analysis for many of them in the same follow-up sampling and assessment. For example, if poor soil biological fertility is a concern, analysis for soil organic matter can be done on the same samples that are used to indicate fertiliser and liming rates. Exchangeable cation measurements can identify the cause of sodicity and help to determine if and how much gypsum is required to ameliorate it.
To facilitate maximum benefit from your soil sampling, follow protocols that are appropriate for the potential constraints and consult with an agronomic consultant.
Soil samples should be analysed by a laboratory accredited with the Australasian Soil and Plant Analysis Council Inc.
If you are testing soil pH, it is important to be aware of the method used. Most laboratories measure pH in a calcium chloride solution, which is preferable as it reduces variability associated with seasonal conditions. However some laboratories routinely use a water extract for pH analyses, which is, on average, 0.7 of a unit lower.
When monitoring soil pH over time and when you are comparing your results to recommended levels, calcium chloride is used as the standard, so remember to adjust the pH value if necessary. Field testing of soil pH with colour kits and pH probes is usually done in water or gives a water-equivalent pH value.
Laboratory analyses for other soil characteristics including nutrients should be by methods that are locally relevant and accurate at predicting likely fertiliser responses.
Follow up or repeat sampling at identical sites every three to four years helps monitor changes in soil characteristics over time and assess the effects of management changes.
Sampling protocols for most constraints
In most cases, sampling at 0-10, 10-20 and 20-30 cm gives a good guide to the pH, nutrient and organic matter profile, and can also detect toxicities like boron and chloride.
Topsoil pH can be quite different from the subsurface soil pH and acidity in the subsurface cannot be detected or estimated by knowing the topsoil pH. Sampling only the topsoil may lead to inadequate lime applications or miss the potential benefits of incorporating lime. In most cases, samples taken at 0-10, 10-20, and 20-30 cm will give a good guide to the soil pH profile and is the best compromise on money spent on sampling and testing and money spent on liming.
For deep sandy soils where little or no lime has been applied to continuously farmed paddocks, samples down to 50 cm or more are necessary to determine a pH profile because the continuing acidification has resulted in low soil pH deeper in the profile.
The preferred depth for nutrient testing in WA is 0-10 cm. Therefore, test results from that depth are correlated with fertiliser responsiveness. Deeper sampling (10-20 and 20-30 cm) is used if 0-10 cm results don’t correspond to fertiliser responses.
For soilborne disease testing using PREDICTA B DNA analysis, samples are taken at 0-10 cm including plant residues.
Paddock variability, particularly changes in soil type and areas that have different crop or pasture growth, should be taken into account when designing sampling programs. It is important not to under-sample; knowing and understanding ‘management areas’ within paddocks will allow targeted inputs to maximise economic return. Position in the landscape, soil survey and farmer knowledge, land use and management history, yield maps, imagery and visual interpretation can all help determine where there is a need to sample. Avoid unrepresentative areas such as stock camps, paddock corners and harvest windrows.
Ideally, take samples in summer when most soils are hot and dry with minimal biological activity. This will minimise the impact of seasonal variation. Seasonal variation in pH can be further reduced by measuring pH in calcium chloride rather than water.
The number of sites and pattern of sampling will vary according to the size and evenness of the paddock, what is being grown, and the soil parameters being tested. You will need to use your judgement, balancing sampling intensity with the number of paddocks you are able to sample and the management costs of the paddock. Use the following as a guide:
- In small pasture paddocks with little soil type variation, a zig zag or ‘W’ pattern is appropriate, taking about 30 samples, to provide a single bulked sample for the paddock
- A large cropping paddock is likely to have management or soil type zones that will need to be taken into account. Usually about six sampling sites are selected across the width and length of the paddock, with two to three sampling sites in each zone, and multiple cores making up a bulked sample at each.
- Sampling for PREDICTA B DNA analysis for soilborne diseases requires a specific sampling protocol that is clearly detailed on the SARDI PREDICTA B website.
In large cropping paddocks, a uniform area of about 30 m should be selected at each site. Cores should be taken across this area (in 10 cm increments), which are then bulked and mixed to give one sample for each of the sampling depths. A useful strategy is to sample proportionately according to row spacing. For every core taken in the row, the number taken between rows should be equivalent to the row spacing in inches. For example, with 6 inch row spacing, two cores in the row and 12 between the row. A greater number of cores gives more accurate results; if you know your site is variable, take more.
Surface organic material such as crop residues, roots, and animal manure should be brushed aside when sampling to prevent misleading and highly variable results, particularly for organic carbon.
Do-it-yourself soil sampling required a dedication to the task with inputs of time for sampling, arranging testing, sourcing recommendations and accurate record keeping to enable comparable repeat sampling over years for monitoring changes in soil quality. Professional soil-sampling contractors should geo-locate sampling sites and usually arrange laboratory testing. They may also provide record-keeping services and recommendation.
Testing on significantly modified soil profiles
Mechanical soil mixing or incorporation of topsoil into the subsurface layers usually results in a highly variable soil profile. Monitoring changes in soil quality will be difficult and require more intensive sampling that usual. In some cases, it will be impossible to achieve meaningful measurements. Particularly where lime has been applied as part of the amelioration, it is best to leave testing to three years after the mixing.
For pH, spraying a face of a soil pit with universal indicator may help to indicate whether there are sufficient pathways of ameliorated soil for roots to grow to depth. However, without the benefit of traditional soil pH sampling, acidification rates will need to be carefully estimated to determine ongoing lime requirements.
Monitoring changes in soil quality is an important part of reviewing soil management and should include:
- Monitoring to gauge if, and when, something will become a constraint.
- Monitoring post amelioration to give confidence the amelioration has worked.
- If amelioration has worked, monitoring that the soil hasn’t relapsed to what it was previously.
Because soil can vary within a paddock, tracking changes requires samples to be collected from the same location over time. Samples need to be properly geo-located, preferably by accurate global position system (GPS), to allow comparable repeat sampling. Unless they are properly set up, mobile phone apps can be inaccurate for getting correct GPS locations.
Sampling 25% of a farm enables a four-year rotation. A three-to-four year time frame is adequate to detect changes in pH and allow adjustments in liming practices. This time is also adequate for key soil characteristics like phosphorus, potassium, salt, and organic carbon which are reasonably constant with ‘normal’ management.
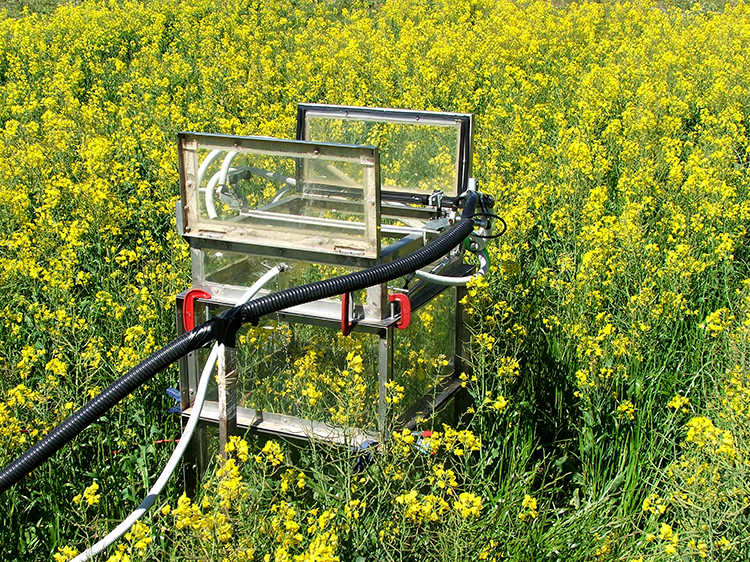
Soil quality issues and constraints are inevitably variable across a paddock and the farm and there are a growing number of sensors that can be used to rapidly measure key soil characteristics over large areas. These sensors either directly record information about the soil itself or map different crop attributes that may provide insights into the underlying soil. These sensors can be carried on machinery that is driven around the farm or be based on airborne or satellite platforms.
This is a rapidly developing area, with the creation of new sensors and techniques for interpreting and using information from these systems. Currently available sensing techniques include: electromagnetics, radiometrics, yield information, optical sensors.
The location of each reading is geolocated so it can be mapped and may be used to help to identify variations in general soil characteristics or specific soil constraints. This information can be important when considering management interventions, providing the opportunity to consider whether these would be uniformly applied or if a more targeted approach is warranted. This may increase the effectiveness and profitability of the management intervention, but should be balanced against the cost of undertaking the survey.
Page references and acknowledgements
Material on this page adapted from:
- Murphy D, Leopold M, van Gool D, Hoyle FC and Stockdale E (2017). Soil Quality: 1 Constraints to Plant Production. SoilsWest, Perth, Western Australia. [Access]
- Pluske W, Boggs G and Leopold M (2018). Soil Quality: 2 Integrated Soil Management. SoilsWest, Perth, Western Australia. [Access]
Last updated July 2024.