Date
2023/08/30
Duration
5 min read
Charts
Craig Scanlan, DPIRD
Artwork
Science with Style
Organisations
SoilsWest
Department of Primary Industries and Regional Development
Grains Research and Development Corporation
Murdoch University
The economic response to fertiliser application is usually assessed as a dose – response; how profit changes as the rate of fertiliser applied increases.
This type of analysis is done with fertiliser recommendation models which take into account soil test data, grain and fertiliser prices and estimates of rainfall-limited yield. The highest part of the dose-profit curve is the profit-maximising rate for the scenario being assessed in the model and the steepest part of this curve is where return on investment is highest.
For fertiliser inputs in grain production, ‘flat payoff’ functions are common. The flat payoff refers to the curvature of the rate-profit response, where a wide range of rates could be applied to achieve similar levels of profit because the rate-profit curve is almost flat. The implication for decision making is that a high level of precision in fertiliser rates is not necessary.
The longer term economic effects of crop sequence and fertiliser decisions are more difficult for farmers and advisors to assess. The economic benefit from having a diverse rotation that provides fixed nitrogen and a break-crop effect depends upon the yield of the ‘break’ crops (grain legumes, canola) in relation to the yield of crops they replace, which are unknown when cropping sequences are being planned. Continuous wheat can be more profitable than a diverse rotation where the yields of the break crops fall below water limited yield potential.
Fertiliser economic response curves
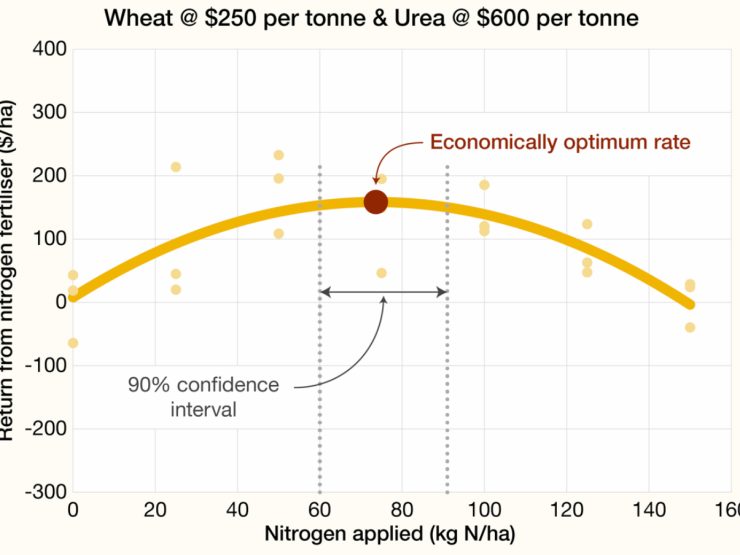
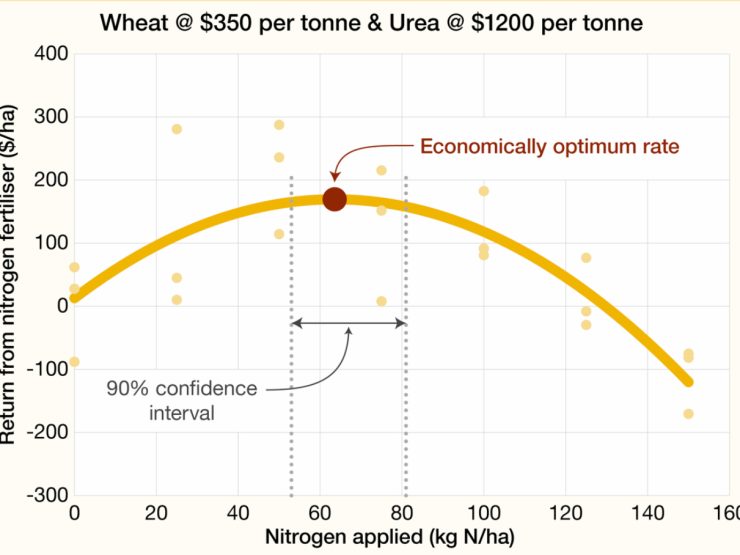
The economically optimum rate for fertiliser depends on the yield response to applying the fertiliser, and the prices of fertiliser and grain.
Economic responses to applying increasing rates of fertiliser to crops in Western Australia tend to be relatively ‘flat’.
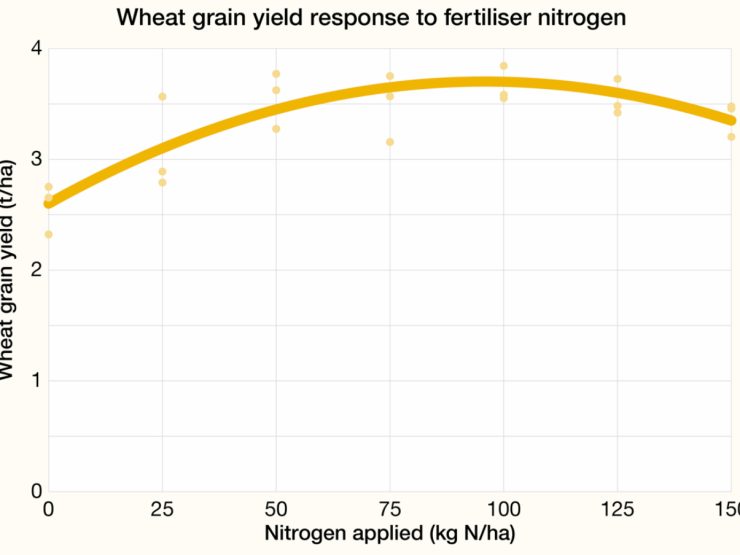
Models are fitted to yield data to help visualise the rate-response, and obtain parameters that can be used in predictive models.
The return from nitrogen is calculated from income where nitrogen was applied (income from grains minus fertiliser costs) minus income with no nitrogen applied. The range of rates that fall within the window that >95% of maximum profit is wide.
References
ebook Soil Quality: 10 Plant Nutrition
Scanlan C, Bell R, Weaver D, Borrett R and Cheng M (2023).


