
Project
SWAN CollaborationDate
2026/06/30
Organisations
Department of Primary Industries and Regional Development
Grains Research and Development Corporation
Authors
Bindi Isbister
Jenni Clausen
Hasinur Rahman
Gaus Azam
Snapshot
Growers: Tony Murfit, Warakirri Cropping
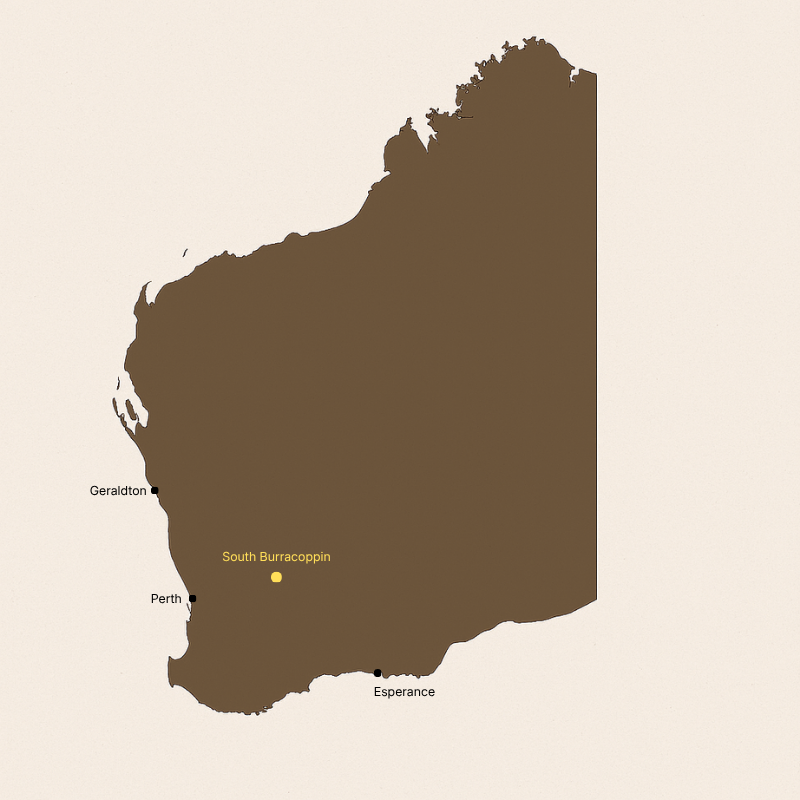
Location: ‘Mawarra’, South Burracoppin
Enterprises: cropping – wheat, barley, canola, lupins, chickpeas (controlled traffic)
Average annual rainfall: 305 mm
Average growing season rainfall: 220 mm
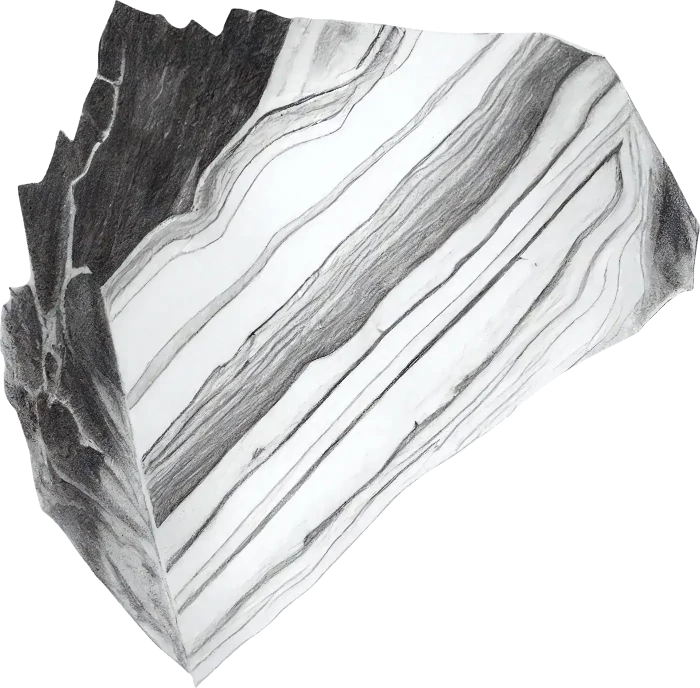
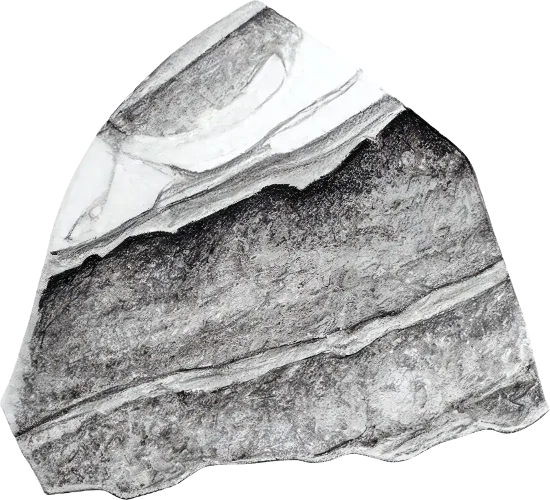
Soil types: deep sand, sandy loam, clay loam
Soil constraints: compaction, subsoil acidity
Area ameliorated: 4000-5000 hectares per year
Amelioration process: deep ripping, one-way ploughing, lime (+ gypsum 2020)
Key messages
- Soil amelioration with lime, ploughing and deep ripping to manage subsoil acidity and compaction has increased yield and water use efficiency in the case study paddock.
- The moderately acidic sands showed the highest yield response after the first amelioration, increasing the proportion of achieved yield potential by an average of almost 50%, equating to an improvement in water use efficiency of 4 kg/ha/mm.
- The second amelioration phase in 2020, with more lime and deeper ripping, improved soil pH and soil organic carbon at 20-40 cm. This resulted in a small increase in achieved yield potential despite variable yields due to extreme seasonal conditions with frost (2021) and low rainfall (2023).
- A record average wheat yield of 3.9 t/ha or 94% estimated yield potential was achieved in the case study paddock in 2022 – demonstrating the value of amelioration when rainfall matches improved soil conditions.
- Economic returns varied with soil type; strongly acidic sands remain challenging despite improvements to soil conditions and yield. Ongoing monitoring is important to maintain good soil pH.
Background
Soils in Western Australia’s wheatbelt are highly prone to compaction, particularly in wet conditions from heavy machinery, which often creates a hard layer between 10–50 cm deep. This compaction restricts root growth and limits access to deeper moisture reserves, which is especially critical in regions receiving less than 300 mm of annual rainfall. Sandy soils also have low water-holding capacity, with deep root development essential for crop resilience.
In addition to compaction, sandy soils in the low rainfall zone are often naturally acidic at depth. Heavier textured soils such as loams have neutral to alkaline pH but, over time, the topsoil can acidify due to the removal of alkaline elements with the grain harvest. To address this, growers apply lime (calcium carbonate) to neutralise soil acidity. Limesand is the most commonly used form of lime in the region due to its high neutralising value, typically between 90–98%. However, its high transport costs to the eastern wheatbelt make it an expensive option for many growers. As a more economical alternative, locally sourced Morrel lime is being used, which has lower neutralising values, typically between 25–50%, and requires higher application rates to achieve similar pH improvement as limesand.
Deep ripping to depths of up to 600 mm is an effective method to break up compacted layers and improve root penetration and access to subsoil moisture. Yet deep ripping alone does not mix lime into the subsoil. To achieve deeper lime incorporation, a combination of ploughing and deep ripping is used. Techniques such as topsoil slotting with inclusion plates can further enhance amelioration benefits, particularly in sandy soils with additional constraints by increasing organic matter down the soil profile.
Research has shown that an integrated approach combining deep ripping, ploughing, and lime to ameliorate compacted and acidic sands can lead to cereal yield increases of 0.3–1.0 t/ha in the first few years after treatment. The initial yield response is primarily due to deep ripping, while the benefits of lime tend to be longer-term. It is important to note that deep ripping responses are less commonly observed in heavier loam soils, as reported by Blackwell et al. (2016) and Parker (2019).
Case study paddock
About 50% of Warakirri’s Mawarra aggregation contains acid gravel/sandplain soils with compaction, acidity and aluminium toxicity causing yield constraints.
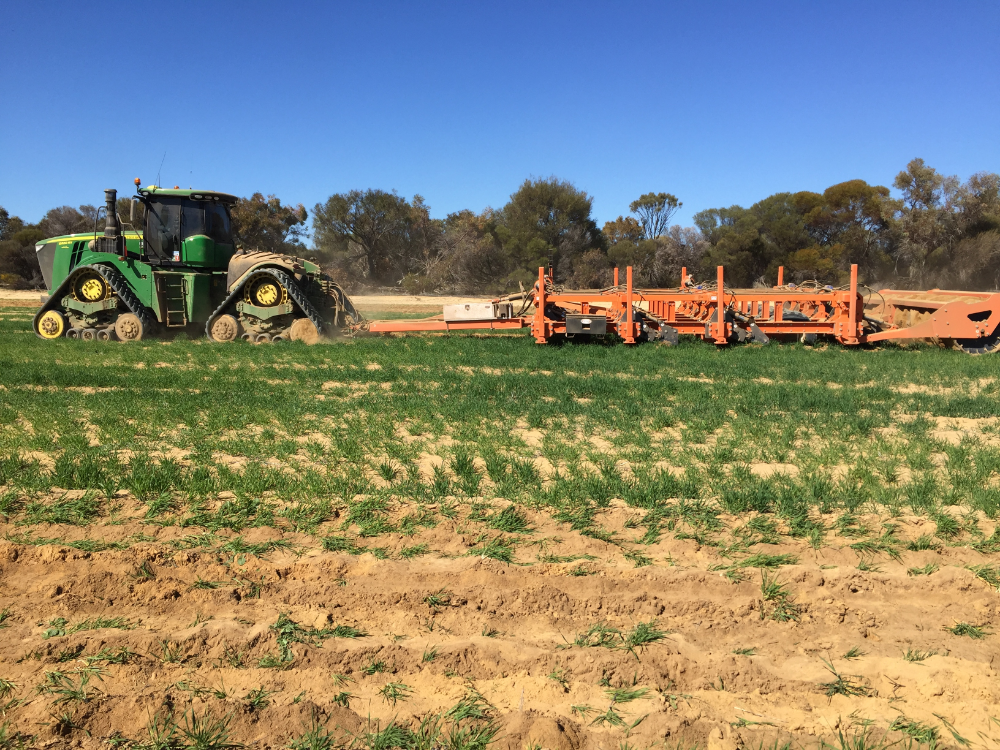
In 2014, DPIRD liming and deep ripping trials on the property resulted in canola yield increases of 0.4–0.5 t/ha in the first year with just 150 mm of growing season rainfall. Encouraged by these results, Tony embarked on a larger soil amelioration program in 2015 with lime (and gypsum as needed) ploughed in using a modified disc plough (Plozza plough), followed by deep ripping. The process has been refined over time to work to deeper depths. About 15-20% (4000 to 5000 hectares) of soil amelioration ‘fallow’ is carried out across the farm each year. It is anticipated this amelioration process will be repeated every 5-10 years with timing dependent on soil moisture conditions and other farm operations.
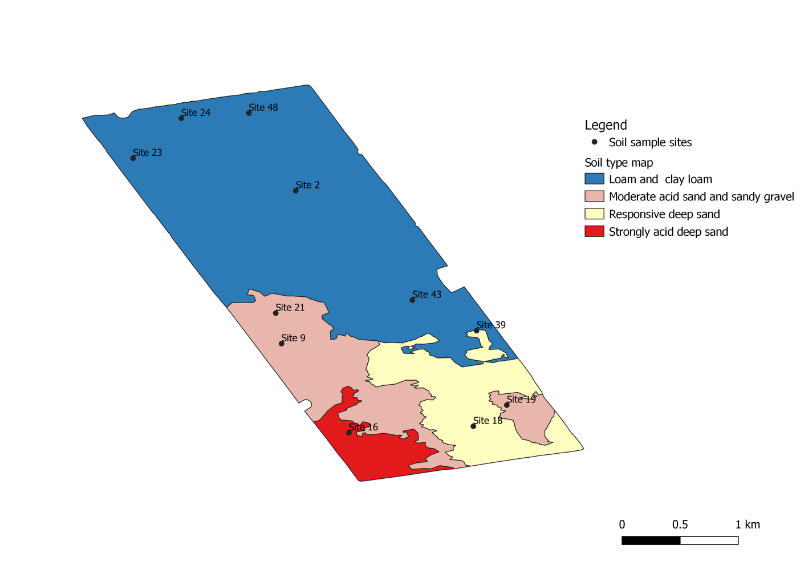
This case study investigates the impact of the amelioration on one of the first paddocks to be ameliorated on the farm. Soil types in the case study paddock range from loam and clay loam, through to deep sands and acid sands (Figure 1). The soil type zones were generated using historical yield and ground-truthed using a combination of Tony’s knowledge of the paddock, soil tests, airborne radio metrics, soil colour from satellite imagery, and elevation. Productivity varies across the paddock and has historically been highest in the loam/clay loam soils and lowest in the acid sands. Soil testing identified areas that required different rates of lime as the subsoil of the acid sands are acidic while the subsoil of the loams is more alkaline.
The first amelioration in the case study paddock occurred in 2015, and the second five years later in 2020:
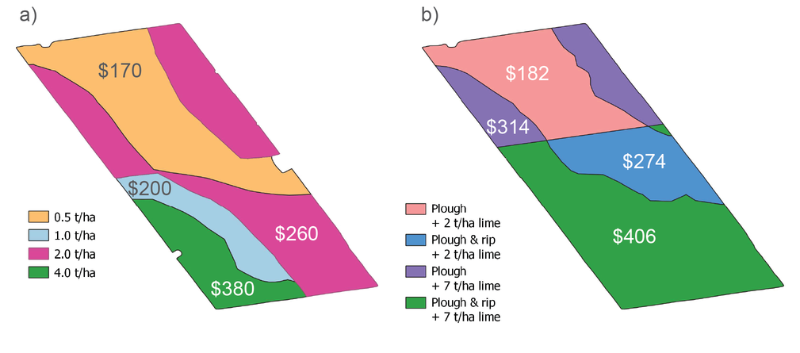
- 2015: variable rate limesand applied at 0.5-4 t/ha (2 t/ha paddock average), followed by standard one-way plough at 150-200 mm, and deep ripping to a working depth of 350 mm (see Figure 2a).
- 2020: variable rate on-farm Morrel lime applied at 2 t/ha and 7 t/ha (5 t/ha paddock average) and 1 t/ha gypsum applied at a blanket rate. Farm trials and laboratory testing found 5 t/ha farm-sourced Morrel lime had the equivalent neutralising value of 2 t/ha of coastal lime. After liming, the paddock was one-way ploughed to 250-350 mm with a modified one-way Plozza plough, the sandier areas of the paddock were deep ripped to a working depth of 600 mm, and all was sown to a cover crop (see Figure 2b).
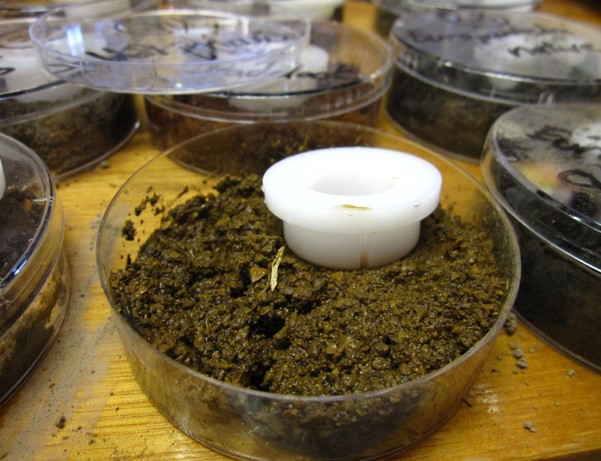
The paddock was monitored for changes in soil properties (at 11 sites) following amelioration across the paddock, and designed to represent each of the major soil types (see Figure 1). Sites were sampled at 10 cm increments to between 50 and 80 cm, depending on ability to get to depth. Particle size distribution was measured to help classify the soil groups.
- The loam and clay loam soils contained 21% clay at 0–10 cm and 37–44% clay at 10–80 cm.
- The sandy soils ranged from 10% clay at 0–10 cm, to 16–18% at 10-80 cm.
Results
Soil acidity
Lime application with plough mixing lifted soil pH, particularly in the 10–20 cm soil layer, indicating that lime had been incorporated well into this layer.
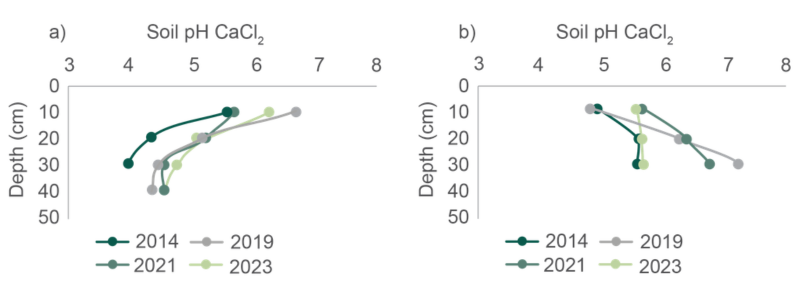
Two of the paddock’s soil test sites have been monitored since 2014, providing a long-term picture of changes in soil pH.
- The moderately acidic sand showed an improvement in pH from the surface to 30 cm (Figure 3a) where 4 t/ha of lime was applied in 2015, and 7 t/ha of Morrel lime applied in 2020 before ploughing and deep ripping.
- The pH of the loam showed improvement at 10-30 cm depth following amelioration when measured in 2019 and 2020.
- By 2023, pH at 10–30 cm was similar to that measured before amelioration (2014) but was still above the target level for this depth of pH 4.8. (Figure 3b). Surface pH remained about 5.5 after amelioration. The loam site had only 0.5 t/ha of lime applied in 2016 and a further 2 t/ha of Morrel lime applied in 2020 because the pH at depth was considered sufficient (see Figure 2). Ongoing monitoring of pH in this soil will be important.
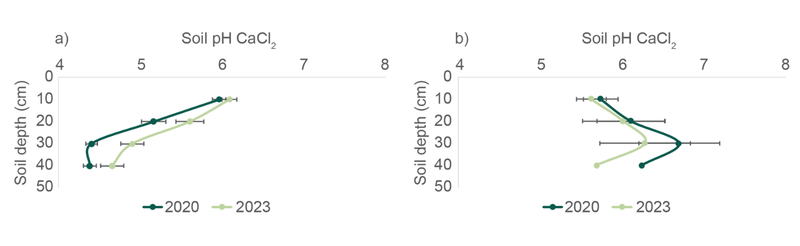
Strategic sampling at the 11 sites across the paddock showed that, on average, there was a significant increase in pH in the five sandy sites when comparing 2020 and 2023 particularly at 10–20 and 20–30cm depth (Figure 4a). By comparison, the average pH of the loam sites was lower in 2023 compared to 2020 but still above recommended target levels. This difference was not significant due to high variability in pH values, likely resulting from uneven mixing or lime applications (Figure 4b). One measurement site, Site 23 (Figure 1), is located near a transition boundary where the lime application rate was reduced, so it could be missing the higher lime applications.
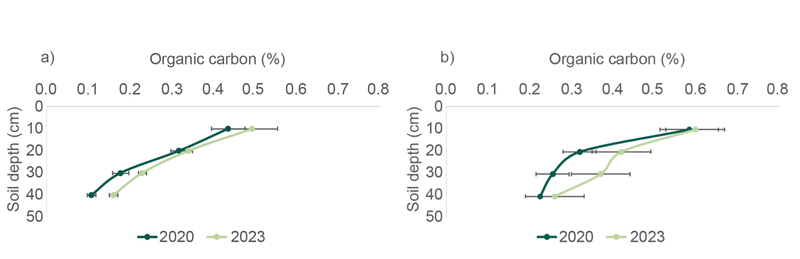
Organic matter
Amelioration increased the proportion of organic carbon at 0–30 cm in the sandy soil types (Figure 5a) but not in the clay loam (Figure 5b), where the plough did not achieve a good working depth, resulting in reduced soil mixing, and where higher variability was observed.
Expected changes in soil density need to be considered to evaluate if any real change in carbon stocks has occurred.
Yield and water use efficiency
Average wheat and canola yields have generally increased with each phase of amelioration, and water use efficiency has improved alongside these gains. For example, wheat yield rose from 1.3 t/ha in 2014 to 2.2 t/ha in 2017 (Figure 6) after the first amelioration. After the second amelioration, wheat yield reached 3.9 t/ha in 2022, a year with above-average growing season rainfall (304 mm). These improvements reflect better soil conditions and more efficient use of available water.
However, yield responses have not been uniform across all seasons. For instance, wheat averaged only 0.91 t/ha in 2023, despite similar rainfall to 2012 pre-amelioration (1.11 t/ha). The difference was largely due to the timing of rainfall: 2012 had 57 mm of spring rainfall during grain fill, compared to just 10.4 mm in 2023.
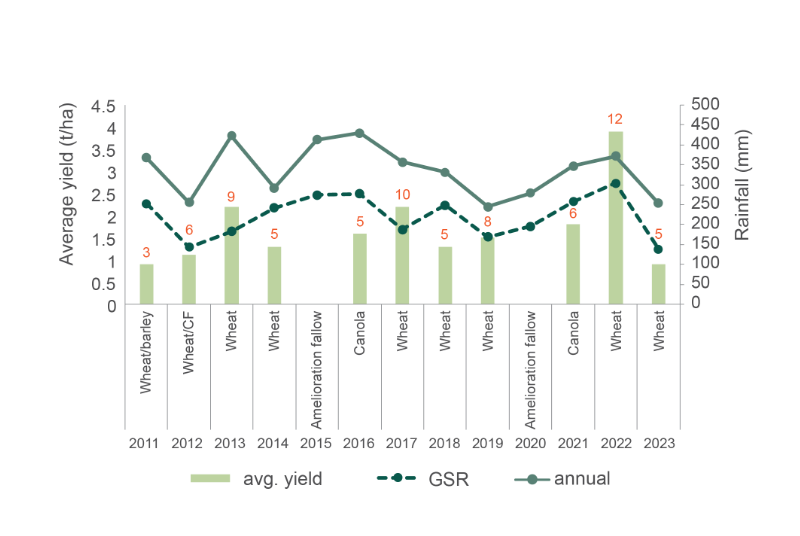
Potential yield is a calculation of total yield possible based on the annual rainfall, with rainfall as the only constraint. The proportion of potential yield achieved, is a measure of how close the actual paddock yield came to the calculated potential yield.
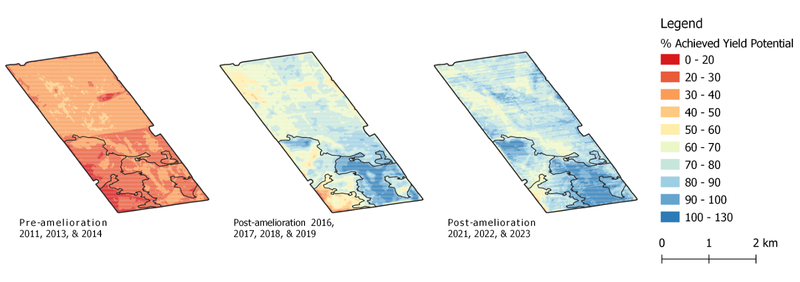
Across sites, the proportion of yield potential achieved increased after the first amelioration in 2015 – particularly in the sandy areas of the paddock (see southern part of the paddock, Figure 7). The sandy soils responded well to lime application and deep ripping. Strongly acidic, deep sands (south-west corner of the paddock, Figure 1) continued to show improvement between the first and second amelioration phases, proposed to be due to an increase in subsoil pH such as measured at Site 9. However, subsoil pH remained below the target level, measuring 4.4 at 20-30 cm depth. Analysing the multi-year yield maps also indicated that the moderate acidic sands and deep sands had the greatest response, achieving more than the estimated yield potential. The deep sands have also been the more consistent high yielding soil types in the paddock.
Multi-year mapping of pre- and post-amelioration performance shows a clear trend:
- Pre-amelioration: the paddock achieved only 0–60% of yield potential.
- Post-amelioration 1 (2015): just 12% of the paddock remained below 60% of yield potential.
- Post-amelioration 2 (2020): only 2% of the paddock is below 60% of yield potential.
The area of the paddock achieving more than 80% of yield potential rose from 25% after the first amelioration to 49% after the second. However, gains following the second amelioration were less consistent, with poor yields under extreme seasonal conditions. Record yields in 2022 highlight the improved yield potential when rainfall aligns with improved soil conditions, but frost and drought events emphasise the need for integrated management beyond soil amelioration—such as crop selection, timing, and risk mitigation.
Economics
First amelioration (2015)
Financial analysis of the Burracoppin case study paddock shows that the first amelioration in 2015 significantly improved profitability for most soil types. Net returns more than tripled for loam, moderately acidic deep sands, and responsive deep sands (Table 1).
However, the strongly acidic deep sand was still not profitable in the first four years after amelioration.
Second amelioration (2020)
The second amelioration delivered strong returns, with a three-year cumulative net benefit of $2,062/ha—equivalent to a $7/ha return on investment (Figure 8). Loam areas achieved the highest return on investment (ROI) because they required less lime and no deep ripping, reducing costs while still benefiting from shallow soil loosening by the plough. Mapping the net return highlights those areas of the paddock that continue to be poor performing to target for further intervention.
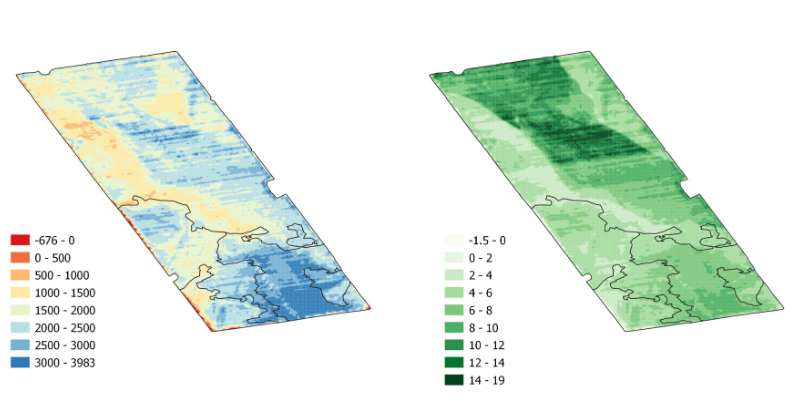
Table 1. Cumulative net return ($/ha) across four soil zones within the Burracoppin case study paddock for pre-amelioration and post-amelioration 1 (2015) and 2 (2020)*. Note that columns 3, 4 and 5 reflect cumulative net benefit $/ha.
* Economic assumptions
Grain price - wheat $280/t, barley $250/t, canola $520/t, chemical fallow -$22/ha.
Operating cost before amelioration $235/ha, after amelioration 1 $285/ha, after amelioration 2 wheat $501 canola $550 (2023 $701).
Cost of amelioration - 1 (2015) lime $60/t deep rip and plough $140; 2 (2020) lime $26.5/ha deep rip $92/ha and plough $30/ha.
See Figure 2 for variable rate amelioration application.
| Zone | Soil type | Pre-amelioration (2011-2014) | Post-amelioration 1 (2016-2019) | Post-amelioration 2 (2021-2023) |
|---|---|---|---|---|
| 1 | Loam and clay-loam | $392 | $1094 | $1895 |
| 2 | Moderate acid deep sand and sandy gravel | $203 | $615 | $2717 |
| 3 | Responsive deep sand | $359 | $1078 | $2729 |
| 4 | Strongly acidic deep sand | -$52 | -$192 | $1915 |
Key findings
- Target highly responsive deep sand soils for maximum return.
- Combine soil improvements with strategies to buffer seasonal variability.
- Monitor soil pH and organic carbon to sustain long-term productivity, as lime requirements change over time with increased grain production.
Lessons learned
- Understanding the constraints to be removed is critical to ensure return from the amelioration investment. Deep soil testing (30-50 cm), quantifying compaction with a penetrometer and zoning paddocks based on gamma radiometrics can be used to identify soil constraints. In this landscape the gamma potassium band can be used to distinguish between sand and clays, which helps inform production zones, lime and fertiliser rates.
- A high-value break crop, such as canola, grown in first year after amelioration can maximise return on investment and create a double break. While rough paddock conditions after amelioration can make establishment challenging, achieving good establishment pays off significantly.
- Deep ripping to 500 mm often brings large and small rocks to the surface, increasing costs and causing trafficability issues for machinery. The soil becomes very soft post-ripping, which can complicate operations.
- Wet soils reduce the effectiveness of ripping and ploughing. Instead of shattering compacted layers, the ripper slices through the soil, and inclusion plates can leave deep trenches, creating uneven surfaces.
- Adding a weighted tyre roller to the ripper helps firm the surface, improving trafficability and crop establishment. Firming also promotes more even wetting, preventing rapid infiltration that previously made crop establishment difficult under low moisture conditions.
- Mapping zones likely to contain rocks allows operators to create ‘no-rip zones’ around headlands and tracks, reducing bogging risks for sprayers and chaser bins. While avoiding headland ripping can result in an opportunity cost of between 2 to 3 t/ha yield, it improves operational efficiency for machinery turning.
- Nutrition requirements have been adjusted upwards to meet increased yield potential of the soil post amelioration.
- Ploughing to mix lime buries the nutrient-rich topsoil, reducing phosphorus (P) availability at the surface. Although nutrients remain at depth, crops cannot access them early in growth stages. Lighter sandplain paddocks with marginal P levels have required additional P fertiliser, as 70% of the topsoil was placed into the mid-soil during incorporation.
- One-way ploughing can leave pockets of acidic soil at the surface. Reapplying lime after amelioration helps achieve uniform pH across the topsoil.
- Improved soil pH levels allow for crops with lower acid tolerance, such as barley, increasing flexibility in crop rotations.
- Cover crops are essential to restore surface cover and organic matter, reducing erosion risk and improving soil stability after ploughing.
Next steps
- The next steps are to map production zones and better match nutritional inputs to each zone’s production potential using variable rate prescription applications.
- This involves collecting detailed data on yield, grain protein, and soil properties to identify zones that are most productive and have longer growing seasons through better water-holding capacity. These high-performing areas can then be pushed harder with higher input strategies.
- Conversely, in underperforming zones, the farm is diagnosing remaining constraints to determine what can be economically addressed and what cannot. Where improvements are not cost-effective, inputs will be reduced to avoid unnecessary expenditure. To validate this approach, fertiliser trials have been implemented across the farm to test whether tailoring inputs to production zones delivers the best economic and agronomic outcomes.
For more information
Bindi Isbister
Research Scientist
Soil Productivity
Grains Research and Innovation
Department of Primary Industries and Regional Development
E: [email protected]
P: (08) 9956 8555
References
Blackwell P, Isbister B, Riethmuller G, Barrett-Lennard E, Hall D, Lemon J, Hagan J and Ward P (2016)
Deeper Ripping and Topsoil Slotting to Overcome Subsoil Compaction and Other Constraints More Economically: Way to Go! GRDC Grains Research Update, Perth, Western Australia.
Parker W, McDonald G, Edwards T, Hall D, and Isbister B (2019)
Influence of the Topsoil Slotting Plate in Root Development and Yield Improvement When Deep Ripping. GRDC Grains Research Update, Perth, Western Australia.
Acknowledgements
The research outlined in this case study was jointly funded by GRDC and DPIRD as part of the DAW1902-003RTX project Re-engineering Soils to Improve the Access of Crop Root Systems to Water and Nutrients Stored in the Subsoil and the DAW2401-001SPX project Soil Water and Plant Nutrition. Thank you to Warrakirri Cropping Mawarra for hosting the case study.